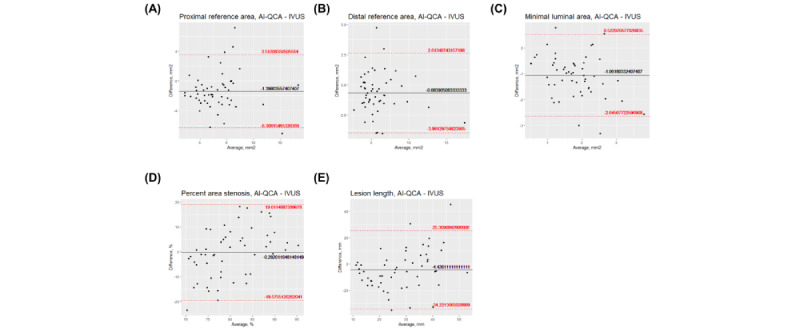
Figure 3.

Bland-Altman plots showing the agreement between artificial intelligence–based quantitative coronary angiography (AI-QCA) and intravascular ultrasound (IVUS) for (A) proximal and (B) distal reference areas; (C) minimal lumen area, (D) % area stenosis, and (E) lesion length. The x-axis is the average of variables measured by AI-QCA and IVUS, and the y-axis is the difference of AI-QCA minus IVUS.
