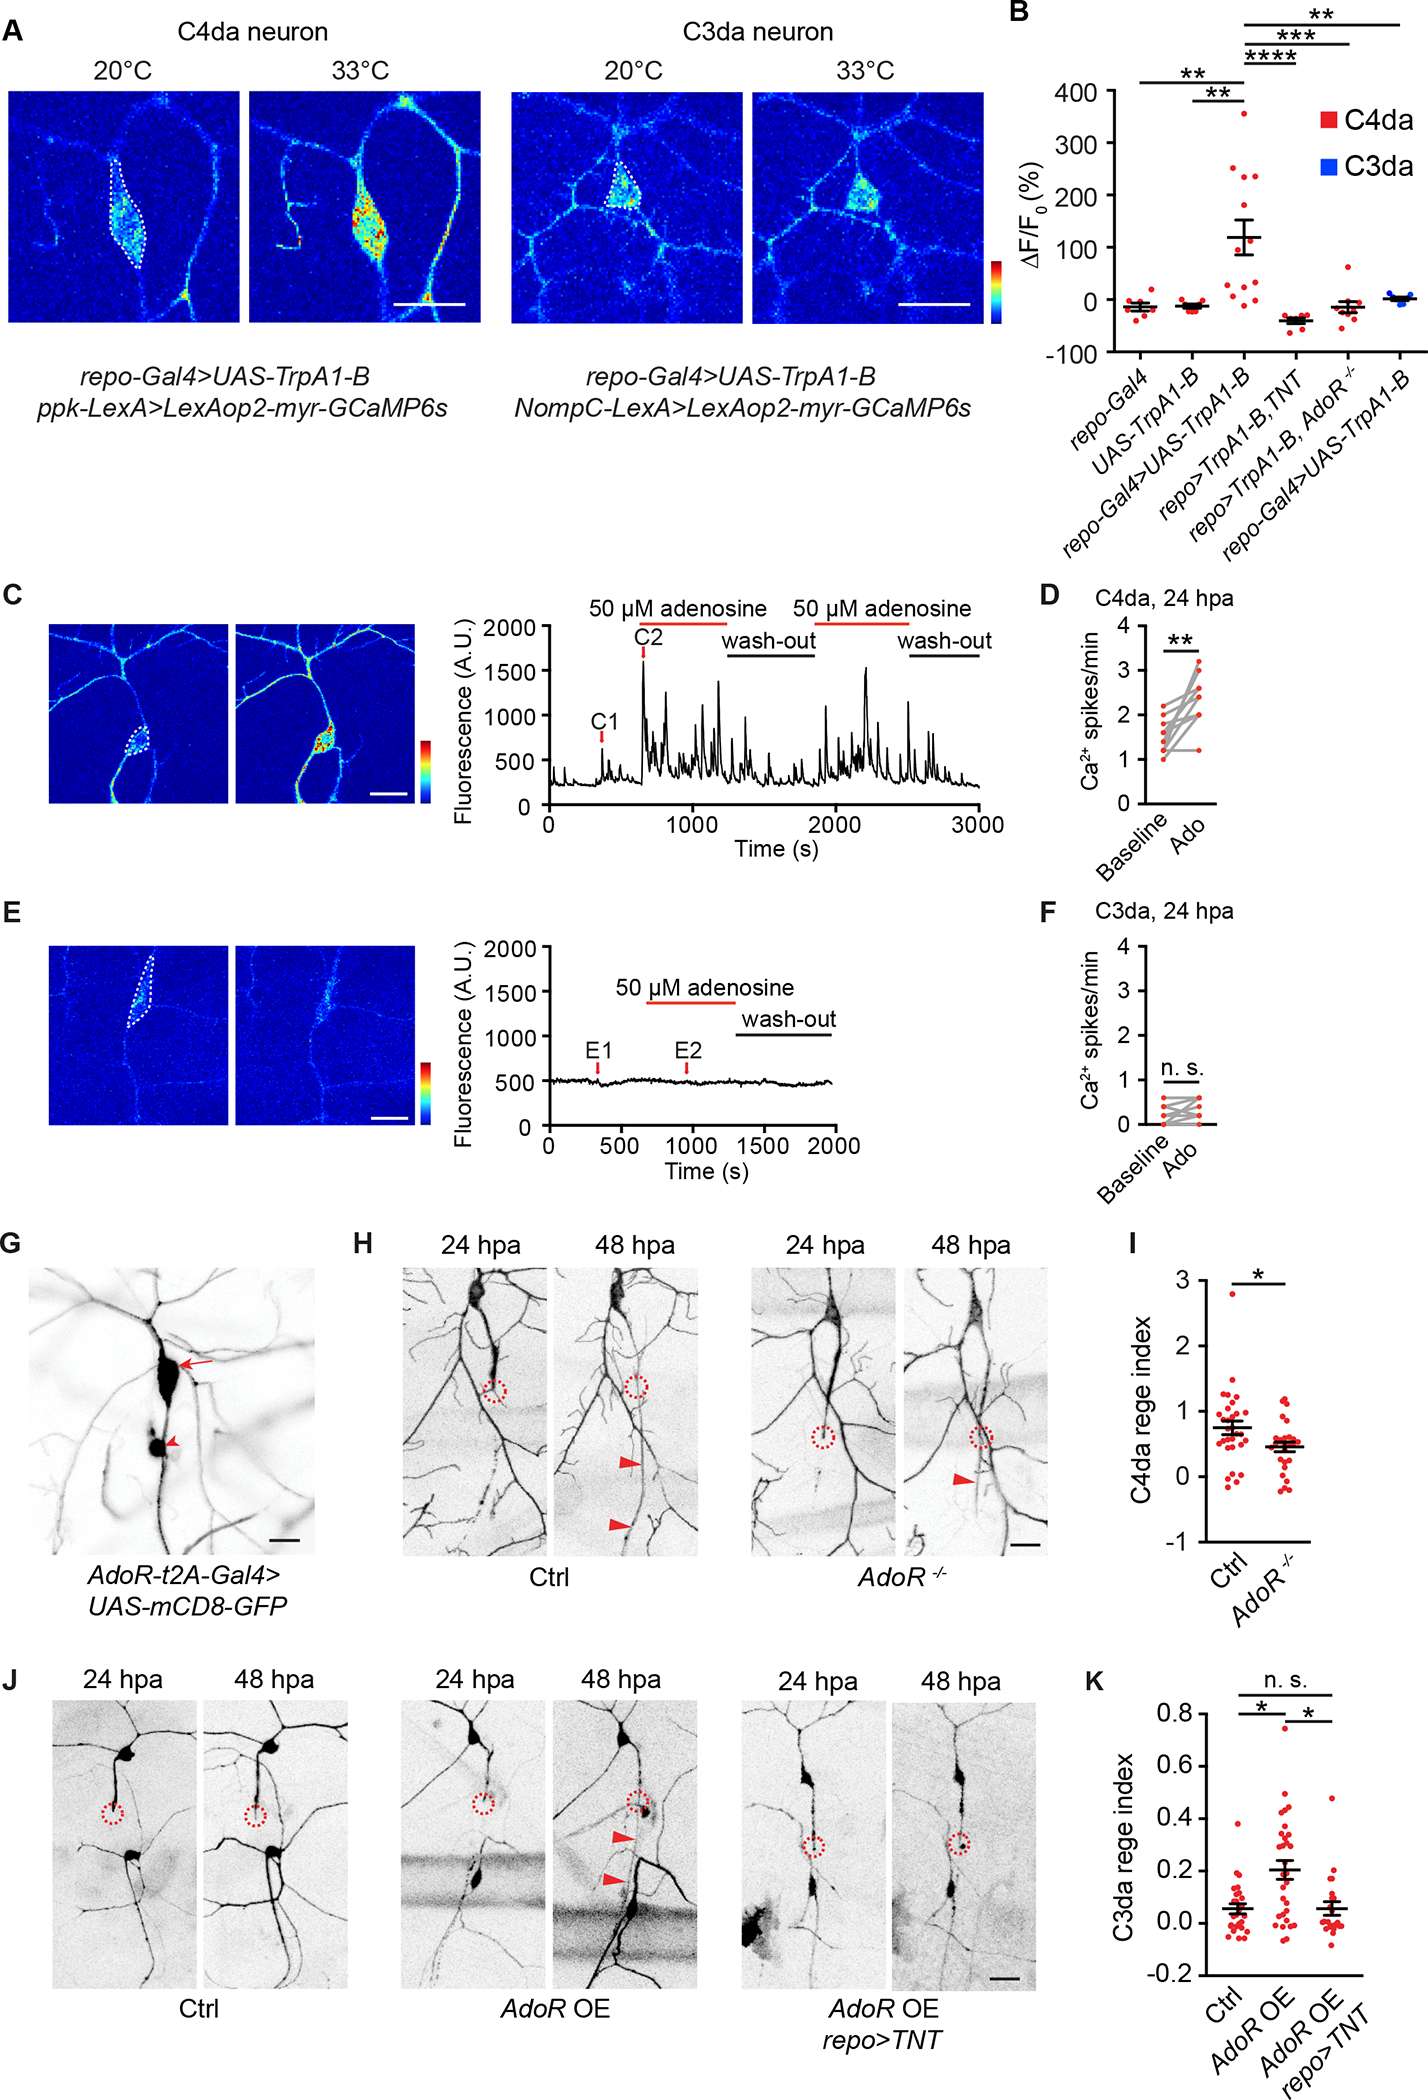
Figure 2. Gliotransmission controls regenerative differences of C4da versus C3da neurons.

(A) Representative GCaMP6s responses of C4da neurons (labeled by ppk-LexA>LexAop2-myr-GCaMP6s) and C3da neurons (labeled by NompC-LexA>LexAop2-myr-GCaMP6s) in response to heating to 33°C. Larvae also expressed TrpA1-B in glia (repo-Gal4>UAS-TrpA1-B). GCaMP6s responses were quantified from neuron somata as indicated by white dashed lines. Scale bar, 20 μm. GCaMP6s color scale: 0–2,500.
(B) Quantifications of neuronal GCaMP6s signals in response to heating to 33°C. Two groups in (A) were presented in the 3rd and 6th column, respectively. C4da neurons were labeled by ppk-LexA>LexAop2-myr-GCaMP6s and C3da neurons by NompC-LexA>LexAop2-myr-GCaMP6s. Additionally, following transgenes were included: 1st column, repo-Gal4. 2nd column, UAS-TrpA1-B. 3rd column, repo-Gal4>UAS-TrpA1-B. 4th column, repo-Gal4>UAS-TrpA1-B, UAS-TNT. 5th column, repo-Gal4>UAS-TrpA1-B; AdoR−/−. 6th column, repo-Gal4>UAS-TrpA1-B. n=7, 7, 13, 7, 9, 7. One-way ANOVA followed by Tukey’s test.
(C-F) Representative GCaMP6s responses and quantifications of axotomized C4da neurons (C-D, ppk-LexA>LexAop2-myr-GCaMP6s) and C3da neurons (E-F, NompC-LexA>LexAop2-myr-GCaMP6s), in response to adenosine. C1-C2 and E1-E2 showed individual frames before and during adenosine application. Scale bar, 20 μm. GCaMP6s color scale: 0–3,000. Adenosine perfusion was followed by washout. Ca2+ spike frequency of axotomized C4da and C3da neurons was quantified from the somata (white dashed lines in (C) and (E)) before and during adenosine application. n=10 for C4da and n=8 for C3da neurons. Two-tailed paired t-test.
(G) GFP signals from a 3rd instar larva bearing AdoR-t2A-Gal4>UAS-mCD8-GFP showed AdoR expression in the C4da neuron (arrow) and another sensory neuron (arrowhead, likely dmd). No GFP signals were found in C3da neurons or ensheathing glia. Scale bar, 20 μm.
(H-I) Representative images (H) and regeneration index (I) of C4da neurons from wildtype larvae (Ctrl group: ppk-CD4-tdGFP) and larvae bearing AdoR deletion mutation (AdoR−/− group: ppk-CD4-tdGFP; AdoR−/−). Scale bar, 20 μm. n=30 and 27. Mann-Whitney test.
(J-K) Representative images (J) and regeneration index (K) of C3da neurons from control larvae (Ctrl group: repo-Gal80, 19-12-Gal4>UAS-EGFP), larvae with AdoR overexpression in C3da neurons (AdoR OE group: repo-Gal80, 19-12-Gal4>UAS-EGFP, UAS-AdoR), and larvae with AdoR overexpression in C3da neurons and TNT expression in glia (AdoR OE, repo>TNT group: repo-Gal80, 19-12-Gal4>UAS-EGFP, UAS-AdoR, repo-QF>QUAS-TNT). n=26, 30 and 22. Scale bar, 20 μm. Kruskal-Wallis test followed by Dunn’s test.
In (H) and (J), circles indicated axotomy sites and arrowheads indicated the regenerated axon. *P<0.05, **P<0.01, ***P<0.001, ****P<0.0001. n. s., not significant.
