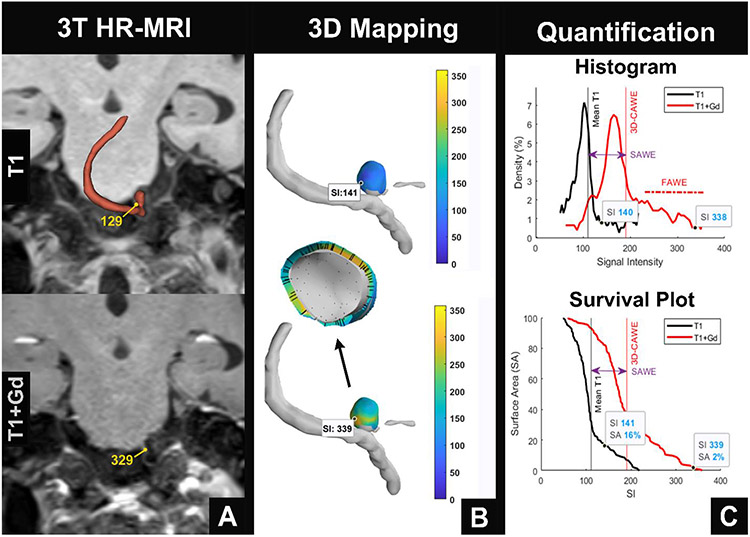
Figure 1. 3D-AWE map of a PICA aneurysm.
(A) Aneurysm segmentations are manually created with 3T HR-MRI, using T1 (top) and T1+Gd (bottom) images. (B) 3D-AWE mapping is generated from orthogonal probes that are automatically extended from the lumen into the aneurysm wall (center). Note that the manual signal intensity (SI) values identified in T1 and T1+Gd images are similar to those obtained through 3D-AWE mapping (T1: 129 vs. 141 and T1+Gd: 329 vs. 339). (C) Quantification of AWE can be visualized through histograms (top) that show the distribution of SI throughout the aneurysm on T1 (black) and T1+Gd (red) images and survival plots (bottom) that identify the surface area of enhancement above different thresholds of SI. Mean SI increases from T1 to T1+Gd imaging with a right shift of the histogram (top). This is defined as SAWE (purple double arrow). There is significant positive skew of the histogram, which is defined as FAWE (top). The survival plot (bottom) shows that on the T1 image, 16% of the aneurysm surface has an SI greater than 141. On the T1+Gd image, only 2% of the aneurysm surface has an SI greater than 339. FAWE is highly concentrated in this area, suggesting that it may be prone to rupture (B, bottom).
PICA = posterior inferior cerebellar artery, AWE = aneurysm wall enhancement, T1+Gd = T1 post contrast gadolinium, SAWE = specific aneurysm wall enhancement, FAWE = focal aneurysm wall enhancement

