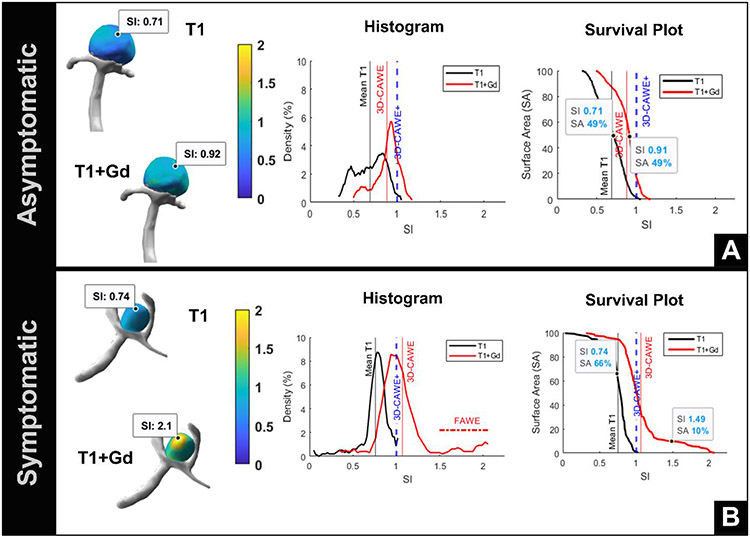
Figure 2. 3D AWE maps of asymptomatic vs symptomatic aneurysms.
(A) An asymptomatic 11-mm basilar tip aneurysm (top) shows a uniform distribution of AWE on the histogram (center) and barely uptakes Gd. This aneurysm is 3D-CAWE− (3D-CAWE < 1). (B) Conversely, a symptomatic 3.5-mm ACOM aneurysm (bottom) is 3D-CAWE+ and has a significant positive skew (FAWE) on the histogram (center). The survival plot (right) shows that approximately 10% of the aneurysm has FAWE. Although this aneurysm is small, it is symptomatic and has a large area of FAWE.
AWE = aneurysm wall enhancement, Gd = gadolinium, 3D-CAWE = 3D circumferential aneurysm wall enhancement, FAWE = focal aneurysm wall enhancement

