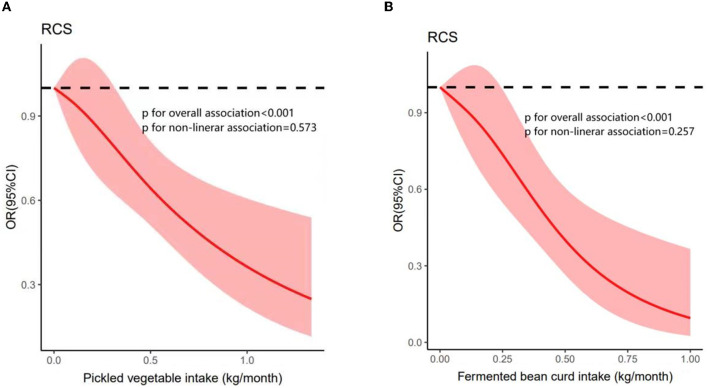
Figure 3.
Adjusted ORs (solid line) and 95% Cls (pink shaded area) for the associations of (A) pickled vegetable intake and (B) fermented bean curd intake with diabetes. The red line represents the estimated OR of diabetes and the pink shaded area represents the 95% Cl around this. The dashed line represents the OR = 1.

