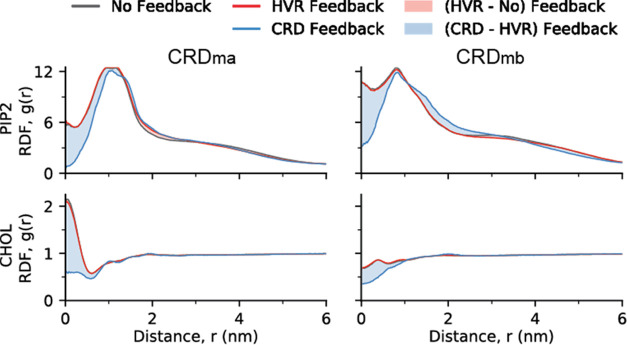
Figure 10.
Effect of feedback-driven changes in secondary structure on lipid–protein RDFs in the CG simulations shown for PIP2 (top row) and cholesterol (bottom row) with two states of RAF1 (left and right). The figure shows the initial RDFs (black), RDFs after HVR feedback (red), and RDFs after the subsequent CRD feedback—the shaded regions highlight the differences between the different stages. The figure highlights the significant differences observed in RDFs after the CRD feedback, demonstrating the value that the on-the-fly feedback capabilities bring for coupling all three scales together, i.e., updating the coarsest (continuum) scale by accounting for the dynamics at the finest (AA) scale through the middle (CG) scale.

