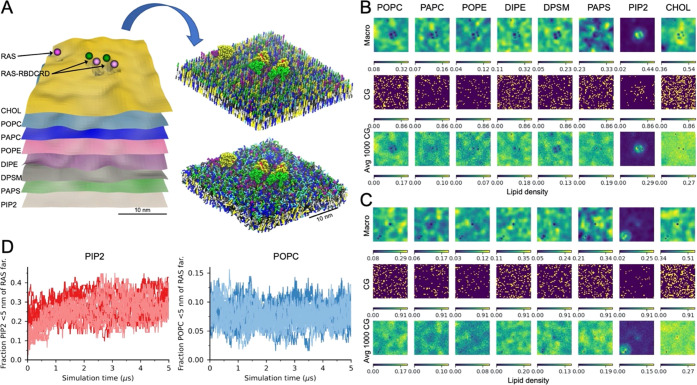
Figure 5.
Converting a continuum patch to a CG simulation. (A) Scheme demonstrating how a 30× 30 nm2 continuum patch is converted into a CG simulation using the Createsims module. (B, C) Inner leaflet lipid densities from the continuum simulation, a single CG lipid placement, and an average of 1000 CG lipid placements shown for a patch with two RAS-RBDCRD and one RAS-only (B) and one RAS-only and one RAS-RBDCRD (C). Note that continuum macro model densities are in lipids per μm2 while the CG setup are counts and averaged counts per cell. (D) Fraction of inner leaflet PIP2 (left) or POPC (right) lipids that are within 5 nm of the RAS farnesyl lipid anchor. The darker color lines show simulations started with the MuMMI continuum-to-CG build routine, while the lighter color lines are the same continuum patches build with a modified routine that randomizes the location of the lipids in each leaflet. Simulations from eight continuum patches are shown, all with one protein, four with RAS-only, and four with RAS-RBDCRD, and starting from different protein conformational states.

