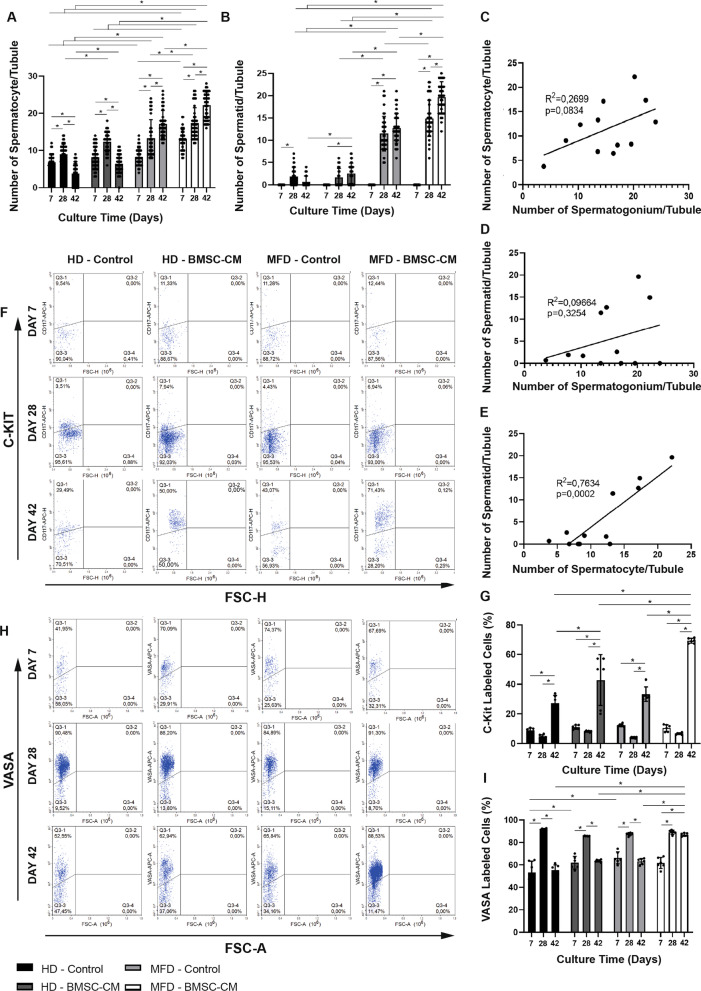
Fig. 4.
BMSC-CM-contributed MFD promotes IVS. In time change in number of a spermatocytes and b spermatids per tubules in BMSC-CM-applied and non-applied groups are shown in bar graph with standard deviation and data distribution (*p < 0.05, n = 6 testes, 50 tubules). Line graphs illustrate positive correlation between the c number of spermatocyte and spermatogonium, d spermatid and spermatogonium and e spermatocyte and spermatid in BMSC-CM-applied and non-applied HD and MFD (R2 = 0.02699, p = 0.0894; R2 = 0.09664, p = 0.3254; R2 = 0.7634, p = 0.0002, respectively). Flow cytometric analysis of f c-Kit(+) and h VASA(+) cell ratio to total testicular cells. Bar graph with standard deviation and data distribution illustrates in time change in g c-Kit and i VASA-labeled cell ratio to total testicular cells in BMSC-CM-applied and non-applied HD and MFD (*p < 0.05, n = 6 testes)

