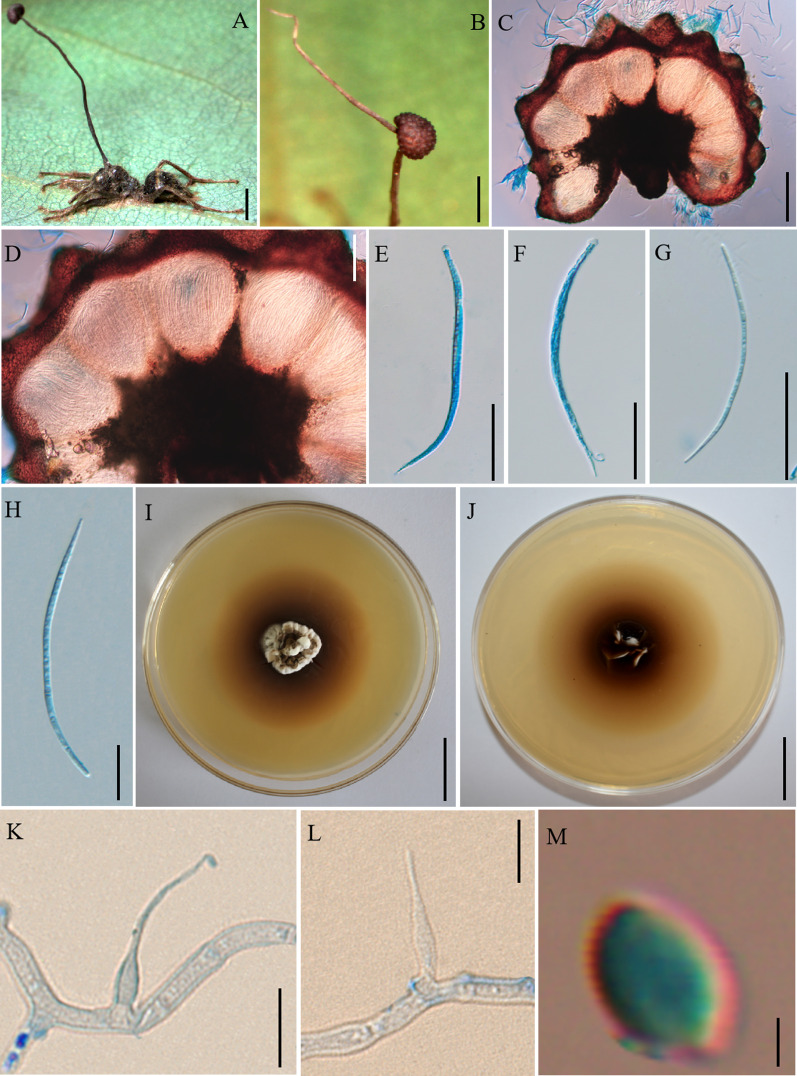
Fig. 3.
Ophiocordyceps acroasca. A: Infected Camponotus sp. was biting into a leaf of tree seedling. B: The ascoma was produced from the stroma. C, D: Cross-section of the ascoma showing the perithecial arrangement. E, F: Asci. G, H: Ascospores. I, J: Colonies on PDA medium. K, L: Conidiogenous cells and conidia. M: Conidia. Scale bars: A = 3000 µm; B = 2000 µm; C = 200 µm; D = 100 µm; E–G = 50 µm; H = 20 µm; I, J = 2 µm; K, L = 10 µm; M = 2 µm

