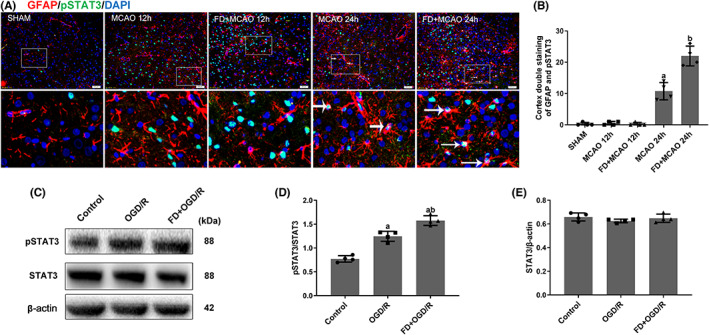
FIGURE 3.

Effect of folic acid deficiency on p‐STAT3 expression in astrocytes. (A, B) Double labeling immunofluorescence of DAPI (blue), GFAP (red) and p‐STAT3 (green) in SHAM, MCAO, and MCAO+FD group rats after12 h and 24 h of reperfusion. Data are shown as mean ± SEM (n = 4). a p <0.05: Compared to SHAM, b p <0.05: Compared to MCAO 24 h. (C) Western blot analyses of pSTAT3, STAT3, and β‐Actin. (D) Representative ratios of pSTAT3 to STAT3. (E) Representative ratios of STAT3 to β‐Actin. Data are shown as mean ± SEM (n = 4). a p <0.05: Compared to Control. b p <0.05: Compared to OGD/R group.
