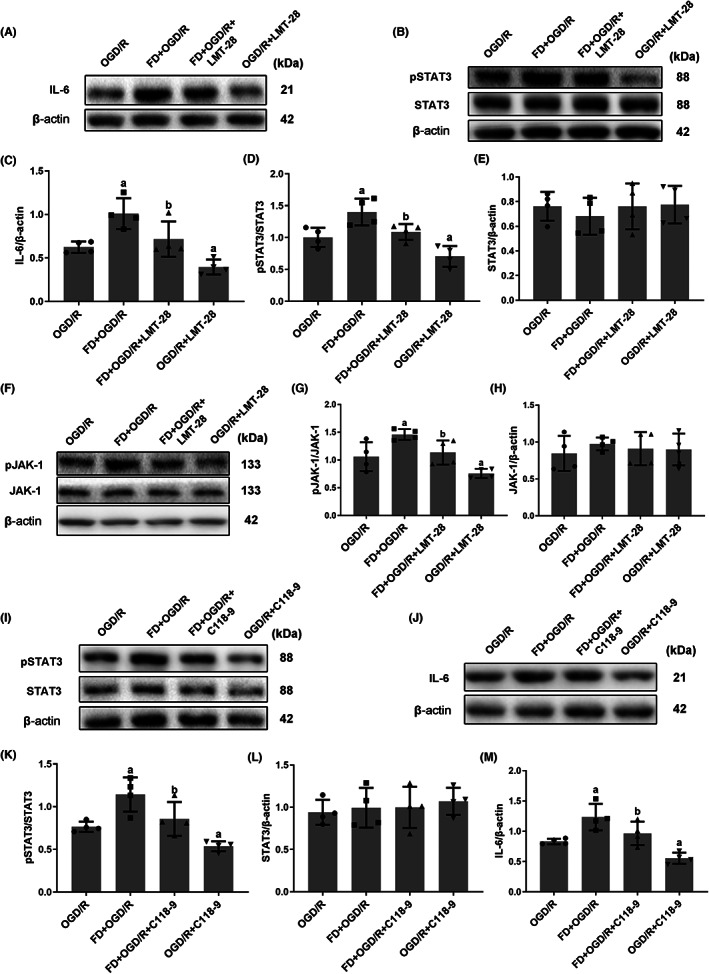
FIGURE 5.

The potential association of IL‐6 and pSTAT3 in hypoxic and glucose‐deficient astrocytes after FD intervention. (A‐H) The cells were harvested after incubating with LMT‐28 (IL‐6 inhibitor). The protein expressions of IL‐6 (A), pSTAT3, STAT3 (B), pJAK‐1 and JAK‐1 (F) were detected by western blot. Bar graphs show the relative levels of IL‐6 (normalized to β‐Actin) (C), pSTAT3 (normalized to STAT3) (D), STAT3 (normalized to β‐Actin) (E), pJAK‐1 (normalized to JAK‐1) (G) and JAK‐1 (normalized to β‐Actin) (H). (I‐M) The cells were harvested after incubating with C118‐9 (STAT3 inhibitor). The protein expressions of pSTAT3, STAT3 (I), and IL‐6 (J) were detected by western blot. Bar graphs represented the relative levels of pSTAT3 (normalized to STAT3) (K), STAT3 (normalized to β‐Actin) (L) and IL‐6 (normalized to β‐Actin) (M). Data shown are mean ± SEM (n = 4). a p <0.05: Compared to OGD/R group, b p <0.05: Compared to FD + OGD/R group.
