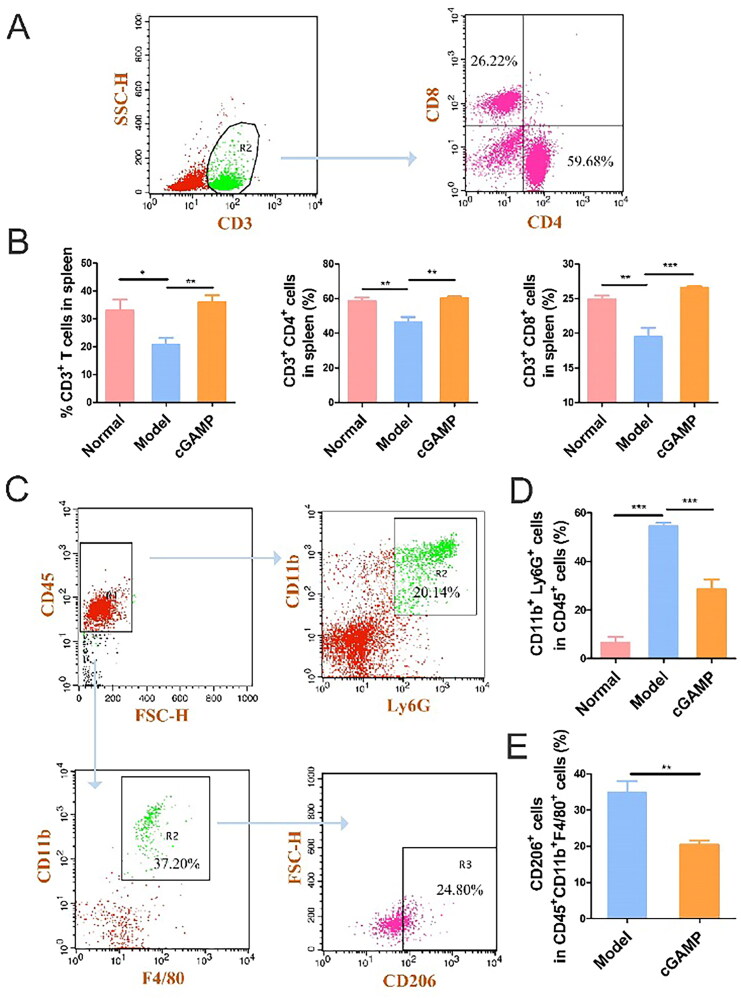
Figure 7.
Flow Immune cells in the spleen were analysed using cytometry. (A) Illustration of a gating method for detecting CD3, CD4 and CD8 in spleens. (B) Percentage of CD3, CD4 and CD8 in spleens. (C) A typical gating technique for detecting M2-TAM and Granulocytic MDSC in spleens. (D) Neutrophil count in spleens expressed as a proportion of viable cells. (E) M2-TAM in spleens was estimated as a proportion of viable cells. Three trials with six mice per group were demonstrated with representative data. GraphPad Prism was used to analyse the data. Data were represented by mean ± SEM, *p < .05, **p < .01 and ***p < .001.

