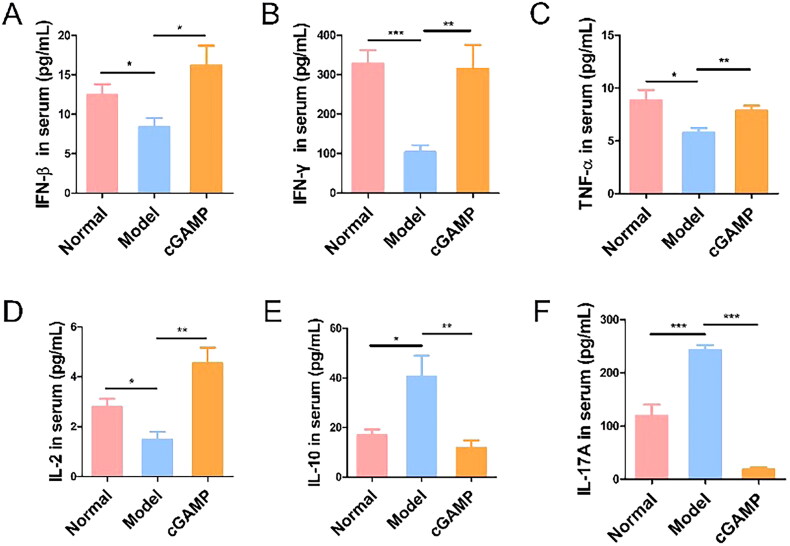
Figure 8.
The expression of IFN-β, IFN-γ, TNF-α, IL-2, IL-10 and IL-17A cytokines in serum were measured by ELISA. Three trials with six mice per group were demonstrated with representative data. Data were analysed through GraphPad Prism. Data were represented by mean ± SEM, *p < .05, **p < .01 and ***p < .001.

