
Figure 8.
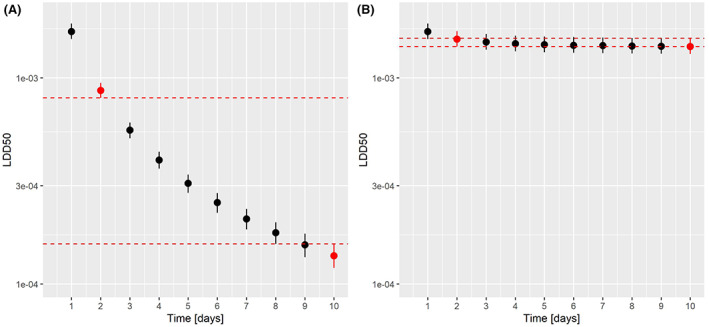
examples of different situations concerning the time course of effects. In panel A, full expression of effects depends on the exposure time. Uncertainty ranges of the LDD50 at 2 and 10 days are well separated (red dotted lines show lower limit of LDD50 at 2 days and upper limit at 10 days). In panel B, effects are almost entirely expressed after a short time. Uncertainty ranges of the LDD50 at day 1 and day 10 overlap. In such cases, the assumptions normally used for estimating chronic exposure are not appropriate