
Figure 21.
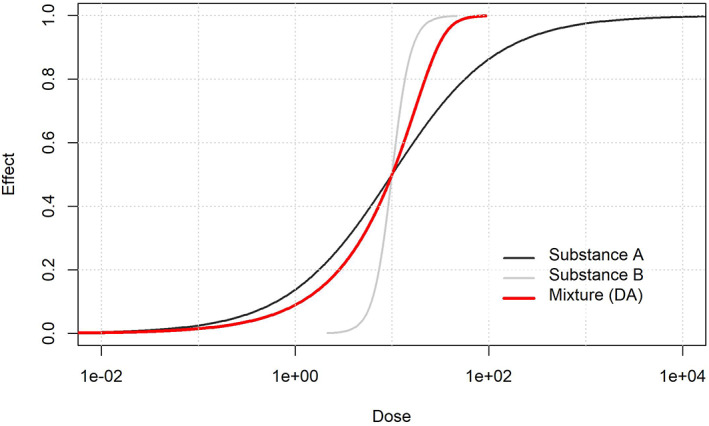
Illustration for a 1:1 mixture of substance A and substance B. Both DRCs of the substances are described by log‐logistic models, with the same LD50 of 10 (generic unit). The (red) curve describing the mixture is closer to Substance A in the left part of the plot, and then closer to Substance B in the right part. This is because the difference in the slope makes substance A the driver of the effects at lower doses and substance B the driver at higher doses. Despite the fact that the DRC of each component is described by a log‐logistic model, the asymmetry of the resulting curve makes it unsuitable to be described by the same model