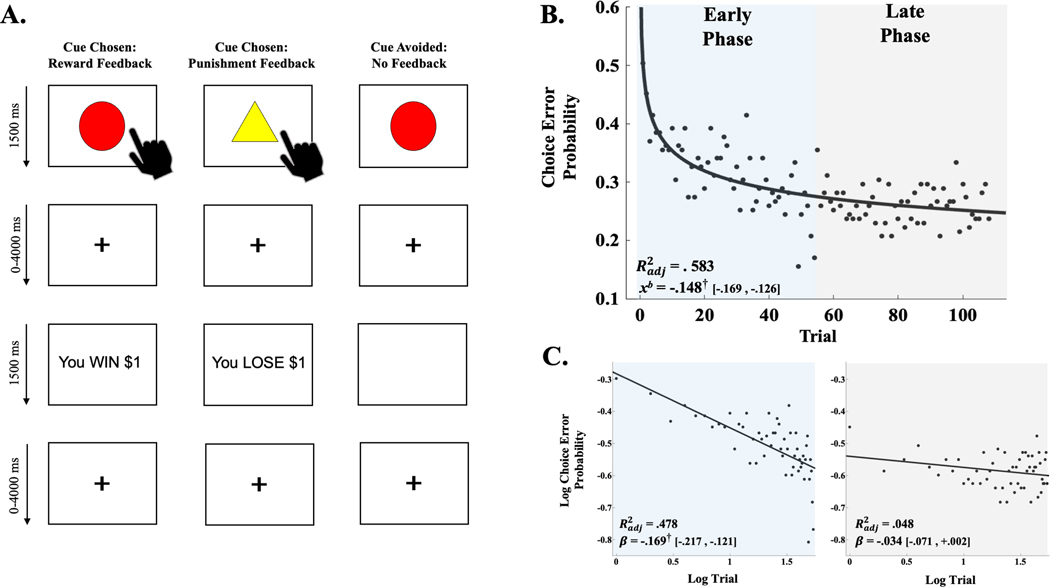
Figure 1.
(A) Illustration of reward, punishment and no-feedback scenarios of passive avoidance task (PAT). (B) Power-series regression curve of choice error probability computed across entire sample for operationalized early- and late-experience phases. Adjusted coefficient of determination (Radj2) and decay coefficient (xb) derived from power-series regression model. Brackets contain parametric, 95% confidence limits of xb. Colour shading illustrates operationalization of early- and late-experience phases. (C) Linear regression curves for log choice error probabilities from early (blue) and late (grey) phase trials. Radj2 and regression slope estimates (β) derived from linear regressions fit to log trial by log choice error probability. Brackets contain parametric, 95% confidence limits of β. † denotes parametric, 95% confidence interval of xb coefficient (B) or log–log regression β (C) did not contain 0. Panel A adapted from Aloi and colleagues3

