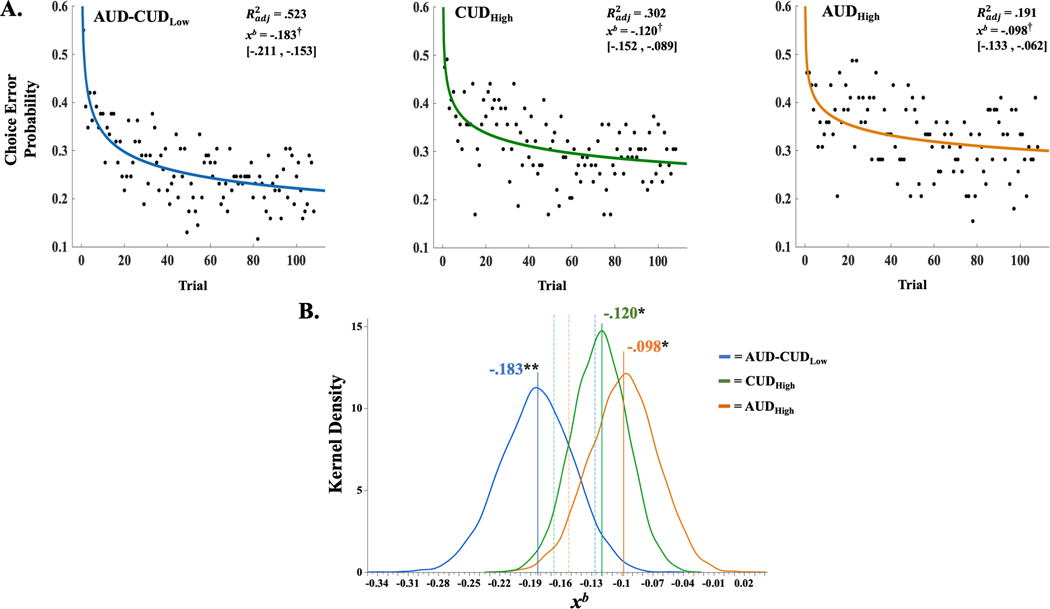
Figure 2.
(A) Power-series regression curves and model fit estimates by group across passive avoidance task (PAT) trials. Adjusted coefficient of determination (Radj2) and decay-rate coefficient (xb) derived from each group’s power-series regression model. Brackets contain parametric, 95% confidence limits of xb. (B) Smoothed frequency distributions (kernel density) of xb coefficient derived from bootstrapped-resampling procedure for adolescents meeting the criteria for significant cannabis (CUDHigh [green]) or alcohol use disorder symptoms (AUDHigh [orange]), compared with adolescents not meeting these criteria (AUD-CUDLow [blue]). Solid vertical lines and associated text reflect parametric xb derived from each group’s power-series regression. Dashed vertical lines reflect 95th percentile limits of bootstrap distribution. † denotes parametric, 95% confidence interval of xb did not contain 0. * denotes CUDHigh or AUDHigh group’s parametric xb did not surpass the upper bound of the AUD-CUDLow group’s 95% confidence limit (95% UCL = −.126). ** denotes AUD-CUDLow group’s parametric xb did not surpass the lower bound of the CUDHigh (95% LCL = −.167) or AUDHigh (95% LCL = −.153) 95% confidence limits

