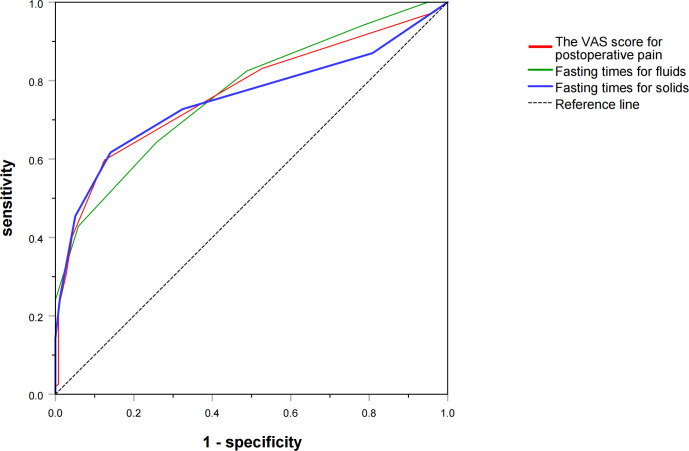
Figure 3.
Risk factors for EA using the ROC curve. Predictive values of risk factors were assessed using the ROC curve. The VAS score for postoperative pain (AUC=0.769, 95% CI: 0.718 to 0.819, p<0.001), fasting times for solids (AUC=0.753, 95% CI: 0.699 to 0.807, p<0.001) and fasting times for fluids (AUC=0.768, 95% CI: 0.719 to 0.816, p<0.001) demonstrated good predictive effects. AUC, area under the ROC curve; EA, emergence agitation; ROC, receiver operating characteristic; VAS, Visual Analogue Scale.

