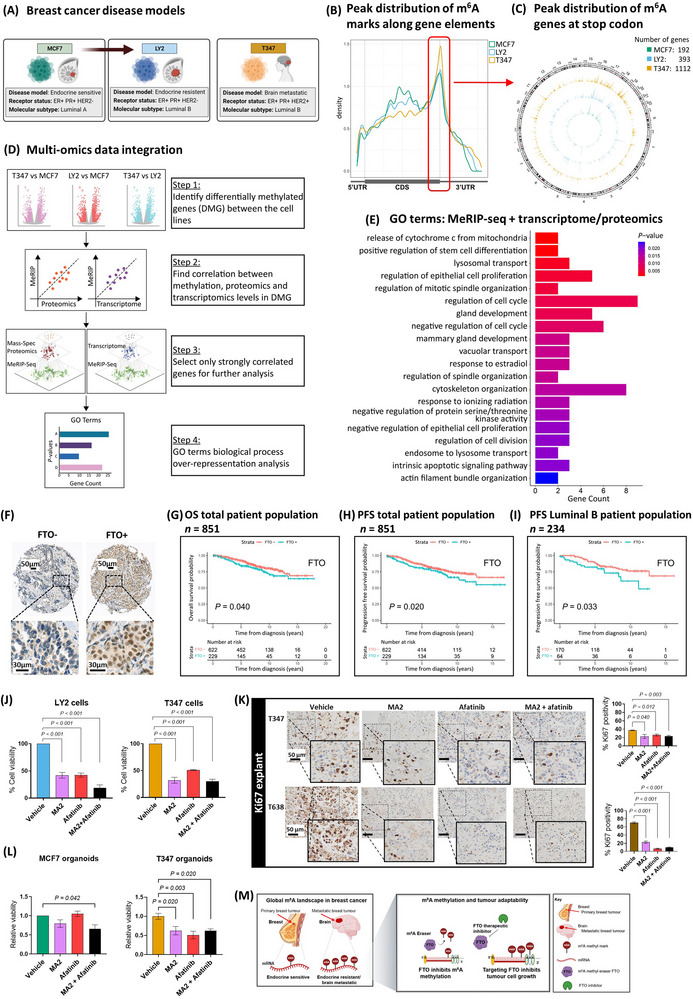
FIGURE 1.

RNA methylation landscape in breast cancer. (A) Schematic representation of breast cancer cells, MCF7 endocrine‐sensitive, LY2 endocrine‐resistant and T347, a model derived from an ER+ treatment‐resistant brain metastatic patient tumor. (B) MeRIPseq density plot of m6A binding along gene elements, 5’UTR, CDS and 3’UTR. The distribution indicates a preference for binding around the stop codon in all three cell models, MCF7, LY2 and T347. (C) Circos plot compares genes with m6A modification at the stop codon for each cell line along chromosomes. The number of genes increases progressively, MCF7 (192), LY2 (393) and T347 (1112). MCF7 (green), LY2 (blue) and T347 (yellow). (D) Data integration multi‐omics factor analysis. Schematic representation of the integration process: DMG discovery (step 1), correlation analysis (steps 2 and 3) and over‐representation analysis (step 4). (E) GO‐term biological process pathways of integration analysis. Pathway analysis of strongly correlated features between MeRIP expression levels and either transcriptomic or proteomic expression, as identified by BioInfoMiner (P < 0.05). Displayed are the top 20 identified pathways. (F) TMA inserts display representative patient tumors with negative (FTO‐) and positive (FTO+) protein expression. Kaplan‐Meier estimates for FTO (G) OS (n = 851, P = 0.040) and (H) PFS (n = 851, P = 0.020) in the total patient population, and (I) PFS in the luminal B molecular subtype (n = 234, P = 0.033). Blue line indicates FTO+, and red line indicates FTO‐ expression. (J) Cell viability assays. LY2 and T347 cells were treated with vehicle (DMSO), MA2 (8 × 10⁻² mmol/L), and afatinib (2.5 × 10⁻⁵ mmol/L) alone and in combination for 72 hours. Significant reduction in cell viability with each treatment was observed (P < 0.001). Assays were performed in triplicate (mean ± SEM, n = 3). (K) IHC analysis for Ki67 protein expression in T347 and T638 PDX explant tissue. Explants were treated for 72 hours with vehicle (DMSO), MA2 (8 × 10⁻² mmol/L), and afatinib (2.5 × 10⁻⁵ mmol/L) alone and in combination. Expression of Ki67 was assessed and quantified using Aperio imaging software. In T347 and T638 explants, MA2 and afatinib alone and in combination significantly reduced Ki67 expression compared to vehicle (P < 0.050, T347 and P < 0.001, T638, n = 6 images/group). (L) Three‐dimensional organoid culture assay. MCF7 and T347 cells were assayed for organoid viability following treatment with vehicle (DMSO), MA2 (8 × 10⁻² mmol/L), and afatinib (2.5 × 10⁻⁵ mmol/L) alone and in combination for 72 hours. MCF7 organoid viability was significantly reduced with combination treatment (P = 0.042) but not with MA2 or afatinib alone. T347 organoid viability was significantly reduced with each treatment (MA2, P = 0.020; Afatinib, P = 0.003; Combination, P = 0.020) (mean ± SEM, n = 3). (M) Schematic of RNA methylation in breast cancer brain metastasis. At a global level, there is a gain in m6A methylated genes with progression to brain metastasis. Pharmacological targeting of the RNA methyl‐eraser FTO inhibits tumor cell growth. Abbreviations: ER+: estrogen receptor‐positive; MeRIPseq: m6A‐specific methylated RNA immunoprecipitation; m6A: N⁶‐methyladenosine; 5’UTR: 5‐prime untranslated region; CDS: coding region; 3’UTR: 3‐prime untranslated region; DMG: differentially methylated genes; GO: Gene Ontology; TMA: tissue microarray; FTO: FTO alpha‐ketoglutarate dependent dioxygenase; FTO+: positive staining; FTO‐: negative staining; OS: overall survival; PFS: progression‐free survival; DMSO: dimethyl‐sulfoxide; MA2: meclofenamic acid (ethyl‐ester form); SEM: standard error of the mean; IHC: immunohistochemistry; Ki67: marker of proliferation; PDX: patient‐derived xenograft.
