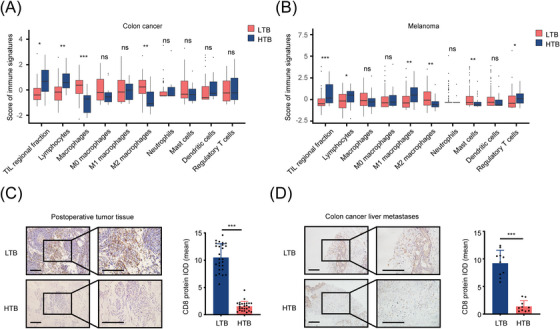
FIGURE 1.

HTB is associated with the decreased amount of CD8+ T cells in TME, (A‐B) Box plots show the scores of immune signatures in the TCGA‐COAD (A) and TCGA‐SKCM (B) cohorts. Boxes represent 25%‐75% of values, lines in boxes represent median values, whiskers represent 1.5 interquartile ranges, and black dots represent outliers, (C) IHC staining showed the amount of CD8+ T cells in colon cancer postoperative tissues (LTB, n = 26; HTB, n = 25; scale bar = 100 μm), (D) IHC staining revealed the population of CD8+ T cells in the needle biopsy samples of liver metastases from patients with colon cancer (LTB, n = 10; HTB, n = 10; scale bar = 100 μm). ns, not significant; *, P < 0.05; **, P < 0.01; ***, P < 0.001. Abbreviations: HTB, high tumor burden; TME, tumor microenvironment; LTB, low tumor burden; TCGA, The Cancer Genome Atlas; IHC, immunohistochemistry; IOD, integrated option density.
