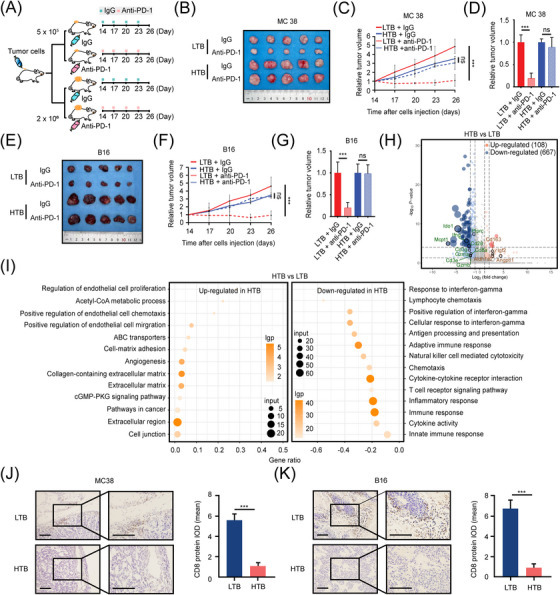
FIGURE 2.

HTB attenuates the efficacy of ICIs and may transform TME. (A) Schematic diagram of LTB and HTB animal model construction for anti‐PD‐1 treatment. Mice were injected with IgG (n = 5) or anti‐PD‐1 antibody (10 mg/kg, intraperitoneal injection, n = 5) every three days from day 14, (B) Subcutaneous tumor of MC38 group mice on day 26, (C) Relative tumor growth curve of MC38 group mice (n = 5), (D) Relative subcutaneous tumor volume of MC38 group mice on day 26, (E) Subcutaneous tumor of B16 group mice on day 26 (n = 5), (F) Relative tumor growth curve of B16 group mice, (G) Relative subcutaneous tumor volume of B16 group mice on day 26, (H) There are 775 genes significantly changed in HTB colon cancer compared to LTB colon cancer. The results were determined by RNA‐seq and shown by the volcano plot. 108 genes were highly expressed in HTB group, and 667 genes were low expressed, (I) GO Enrichment analysis showed that the immune relevant biological process is strongly correlated with tumor burden, (J) The population of CD8+ T cells in MC38 subcutaneous tumor is less in HTB group than in LTB group (scale bar = 100 μm), (K) The amount of CD8+ T cells in B16 subcutaneous tumor is less in HTB group than in LTB group (scale bar = 100 μm). ns, not significant; ***, P < 0.001. Abbreviations: HTB, high tumor burden; ICI, immune checkpoint inhibitor; lgp, ‐log10(p‐value); TME, tumor microenvironment; LTB, low tumor burden; PD‐1, programmed cell death protein 1; RNA‐seq, RNA sequencing; GO, gene ontology.
