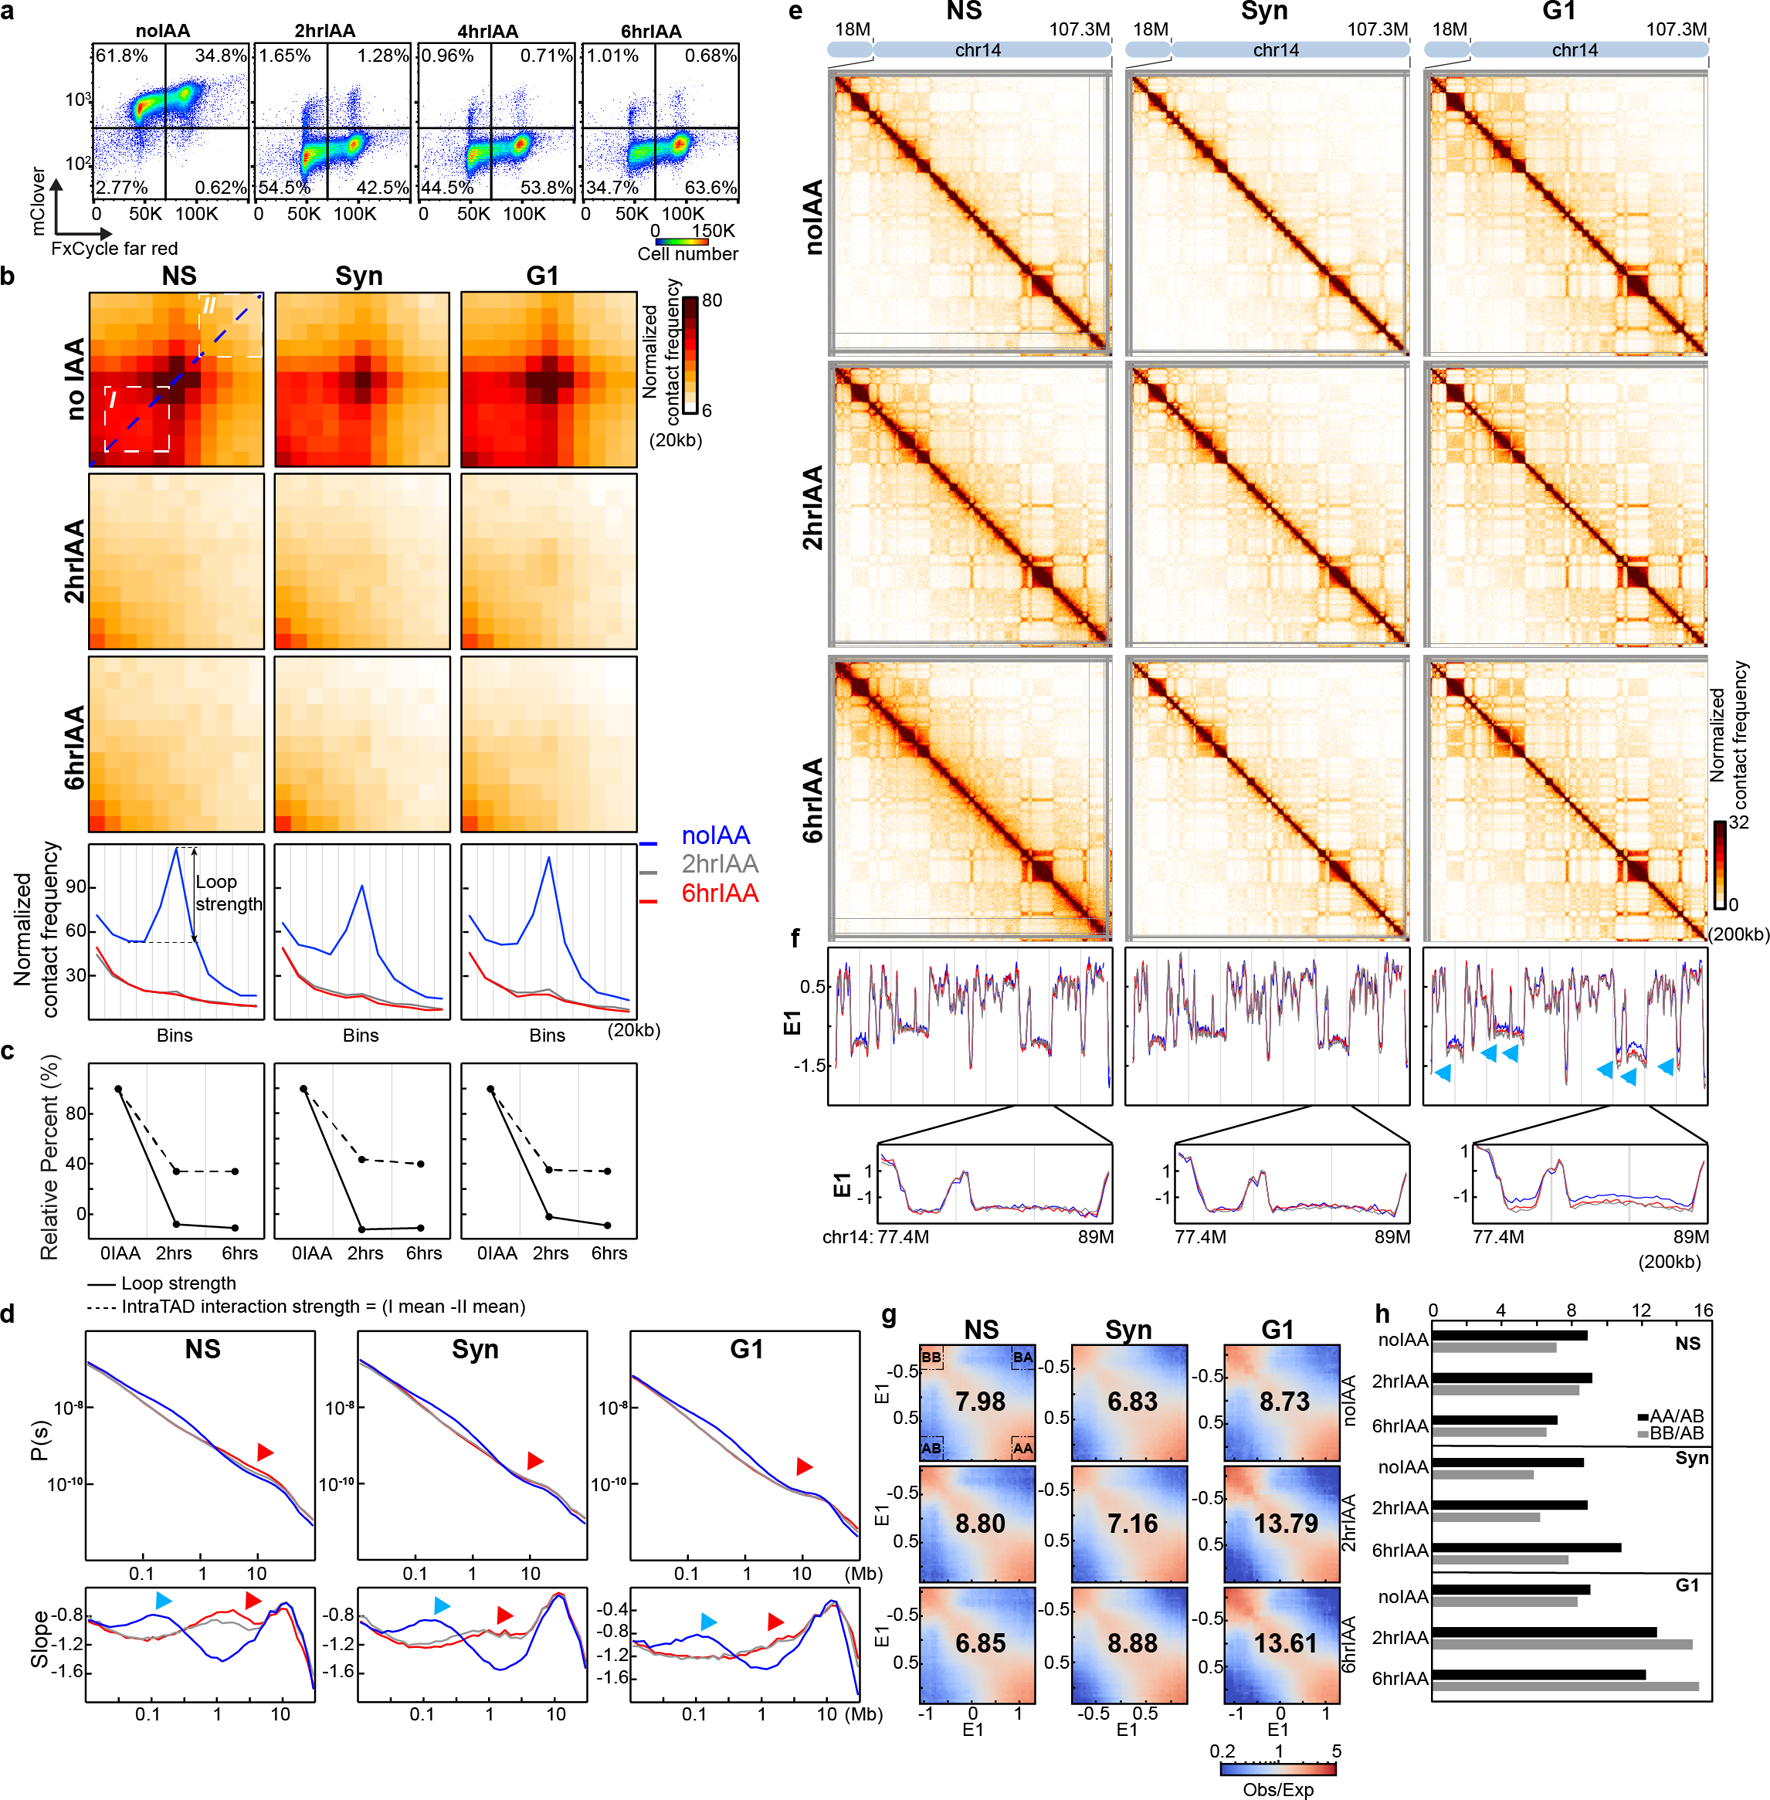
Fig. 1. RAD21 degradation in G1 cells eliminates CTCF-CTCF loops and TADs, but enhances compartmentalization.

(a) FACS analysis of HCT116-RAD21-mAC cells treated with 500uM IAA as shown. The percentages in four squares indicate G1 cells with high (top left), or low RAD21 levels (bottom left), G2/M cells with high (top right), or low RAD21 levels (bottom right). (b) Aggregated Hi-C data at 3169 loops in HCT116-RAD21-mAC cells by22. Plots at the bottom show average Hi-C signals along the dotted blue lines representing signals from the bottom-left corner to the top-right corner of the loop aggregated heatmaps shown in upper panels (c) Loop strength and intra-TAD interaction strength. (d) P(s) plots (upper panels) and the derivative from P(s) plots (lower panels) for Hi-C obtained from cells grown as indicated. The red arrows indicate the increased interaction frequency at s=10Mb (upper panels) and the appearance of condensin loop arrays structures (lower panels). The blue arrows indicate the signature of cohesin loops in each condition without IAA. NS and Syn experiments were repeated once as confirmation of previous studies. Hi-C experiments for G1 cells were repeated independently three times and the results in Fig. 1 and Extended Data Fig. 1 are from the pool of three replicates. (e) Hi-C interaction maps for NS, Syn, and G1 cells treated with IAA as shown. Data is for the 18–107.3 Mb regions of chromosome 14. (f) Eigenvector value E1 across the same region as in e. The blue, grey and red lines represent: 0, 2 and 6hour IAA treatments, respectively. Bottom, E1 for the 77.4–89Mb region. Blue arrows indicate changes of E1. (g) Saddle plots treated with IAA as shown. Saddle plots for each condition were calculated using the E1 from the Hi-C data obtained with cells grown without IAA. The numbers at the center of the saddle plots indicate compartment strength (see methods). (h). Interaction strength of compartments. Dark and grey bars indicate strength of A-A and B-B interaction respectively (see methods). See source data for numerical data.
