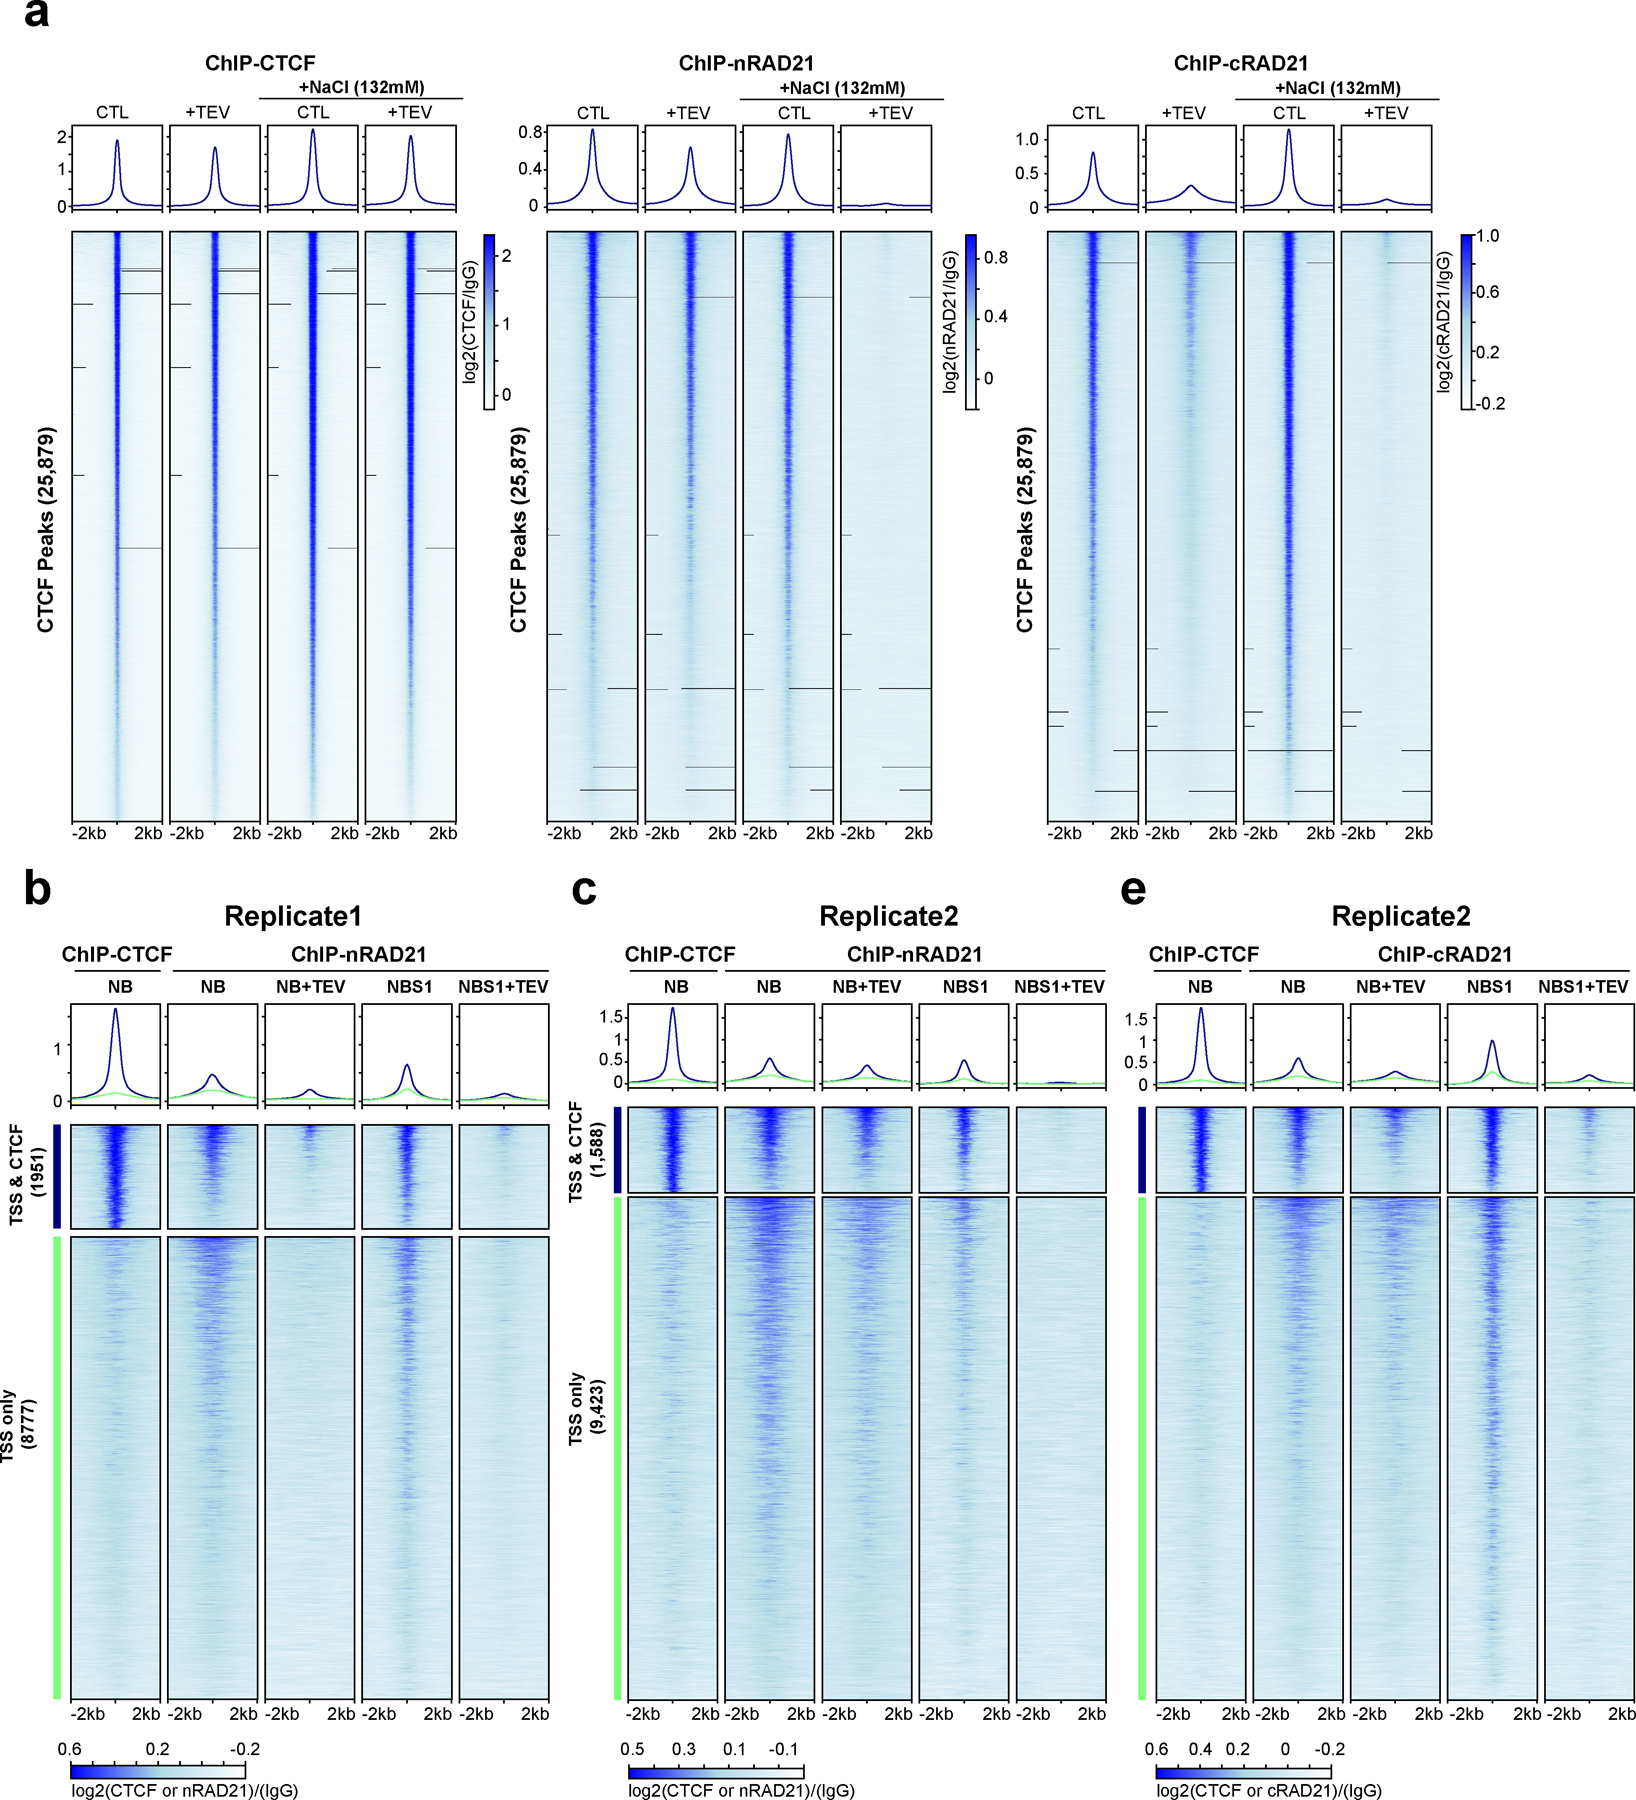
Extended Figure 5. A replicate of ChIP analysis of the nuclei with cleaved RAD21 in NBS1.

(a) Profiles of ChIP signals of CTCF and RAD21 at CTCF binding sites, from nuclei treated with TEV in the specified buffers as shown. Data shown are for biological replicate 2, an independent replicate is shown in Fig. 3h. 25,879 CTCF binding sites were identified from CTCF ChIP data of nuclei without TEV treatment in NB. Upper panel, average CTCF and RAD21 ChIP-seq signals for each condition for the set of 25,879 CTCF binding sites. Two different RAD21 antibodies were used, nRAD21 recognizes the N-terminal domain of RAD21, as used in Fig. 3h; cRAD21 recognizes C-terminal domain of RAD21. Lower panel, heatmap of CTCF and RAD21 ChIP-seq signals of each condition at each of the 25,879 CTCF binding sites. (b) Profiles of ChIP signals of CTCF and RAD21 at active transcription start sites (TSS) treated with TEV in the specified buffers as shown. Of 13,412 active TSS of HAP1 cells, 1,951 overlapped with CTCF binding sites while 8,777 did not overlap with CTCF binding sites (2kb away from CTCF binding sites). Both average ChIP signals (upper panels) and heatmap of ChIP signals of CTCF and RAD21 for these two groups of TSS sites are shown. (c) Biological replicate of the experiment shown in panel b. Of 13412 active TSS sites, 1,588 were overlapped with CTCF binding sites while 9,423 did not overlap with CTCF binding sites. Dark blue and orange lines indicate TSSs that overlapped or did not overlap with CTCF binding sites, respectively. Both average ChIP signals (upper panels) and heatmap of ChIP signals of CTCF and RAD21 on these two groups of TSS sites are shown. Right panel includes a RAD21 ChIP data using the RAD21 antibody that recognizes C-terminal of RAD21. Dark blue and orange lines indicate TSS that overlapped or did not overlap with CTCF binding sites, respectively.
