
Extended Figure 7. Two biological replicates of Hi-C analysis of nuclei with RAD21 cleaved in NBS2 buffer (with Supplementary Fig. 2).
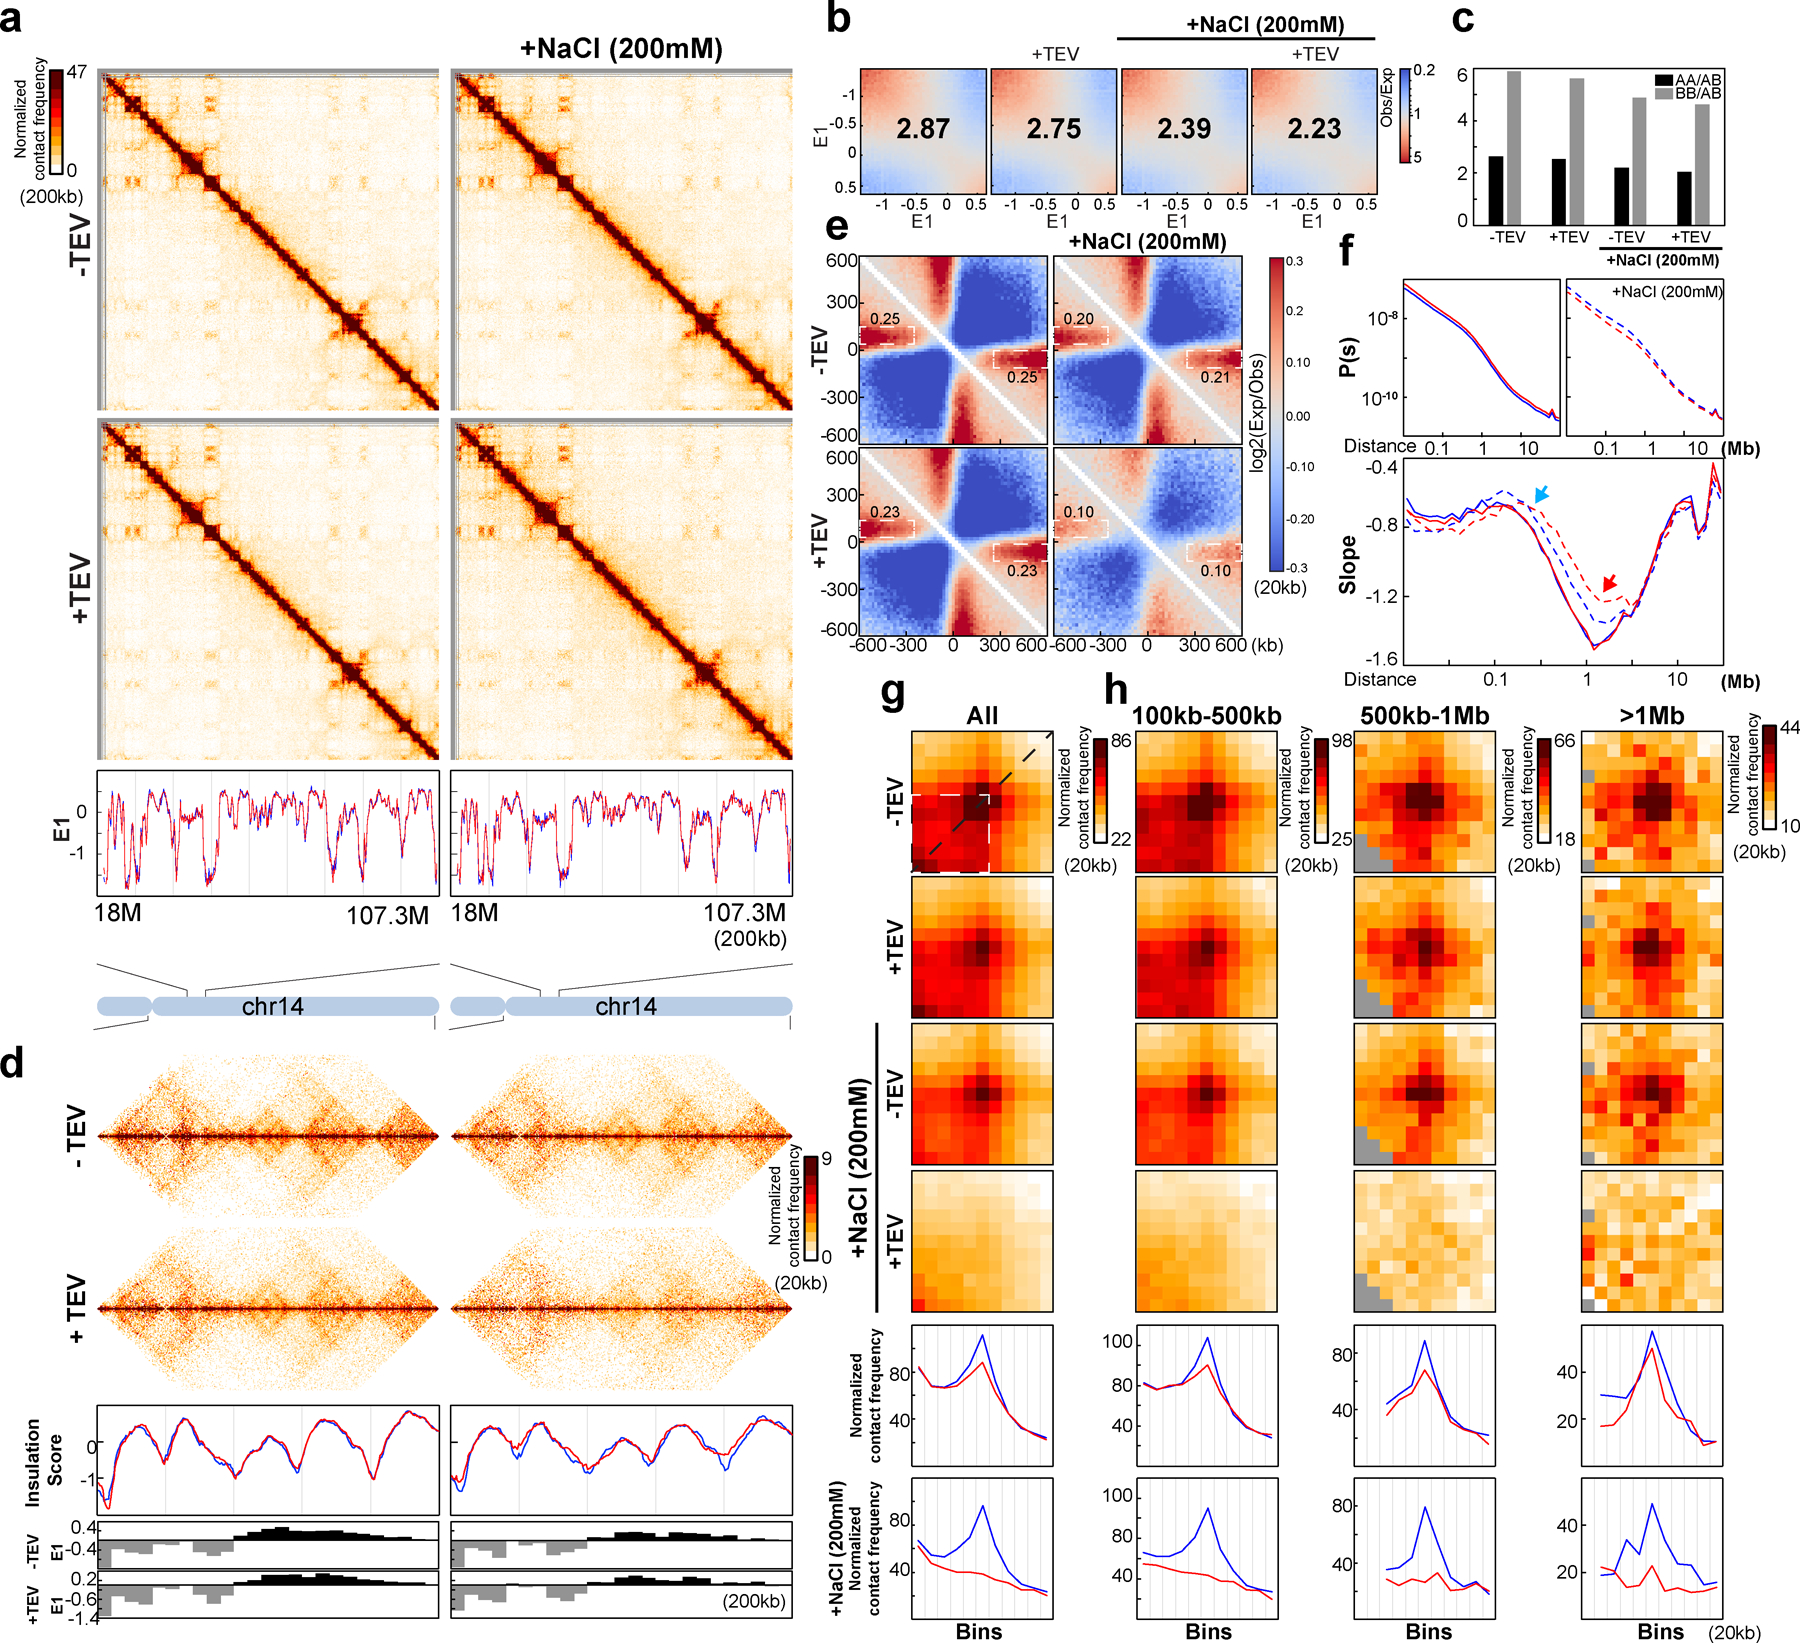
(a) Hi-C maps for HAP1-RAD21TEV nuclei treated with TEV in specified buffer sas shown. Data for the 18–107.3 Mb region of chromosome 14 is shown. Bottom, E1 across the 18–107.3 Mb region of chromosome 14. (b) Saddle plots for HAP1-RAD21TEV nuclei treated with TEV in specified buffers as shown. Numbers indicate compartment strength. (c) Interaction strength of compartments. Bars represent strength of compartment interactions for each sample as described in Fig1h. (d) Hi-C maps for HAP1-RAD21TEV nuclei treated with TEV in specified buffers as shown. Data for the 29–34 Mb region of chromosome 14 is shown. Middle panels indicate insulation profiles for the 29–34 Mb regions of chromosome 14. Blue and red lines represent without and with TEV protease treatment, respectively, as in panel a. Lower panels indicate E1 across the same region. (e) Aggregate Hi-C data at TAD boundaries identified in the sample in NB buffer without TEV treatment. Numbers at the sides of the cross indicate strength of boundary-anchored stripes using the mean values of interaction frequency within the white dashed boxes. (f) P(s) plots (left panels), and derivatives of P(s) plots (right panels) for Hi-C data from nuclei treated with TEV as shown. Blue arrows indicate the signature of cohesin loops in each condition. Red arrows indicate changes of contact frequency at 2Mb. (g) Aggregated Hi-C data at loops as in Fig. 2j. Lower panels: average Hi-C signals along the blue dashed line shown in the upper left Hi-C panel. (h) Aggregated Hi-C data at chromatin loops of three different loop sizes as indicated. Lower panels: average Hi-C signals along the blue dashed line shown in the left Hi-C map in Fig. 2j. See source data for numerical data.