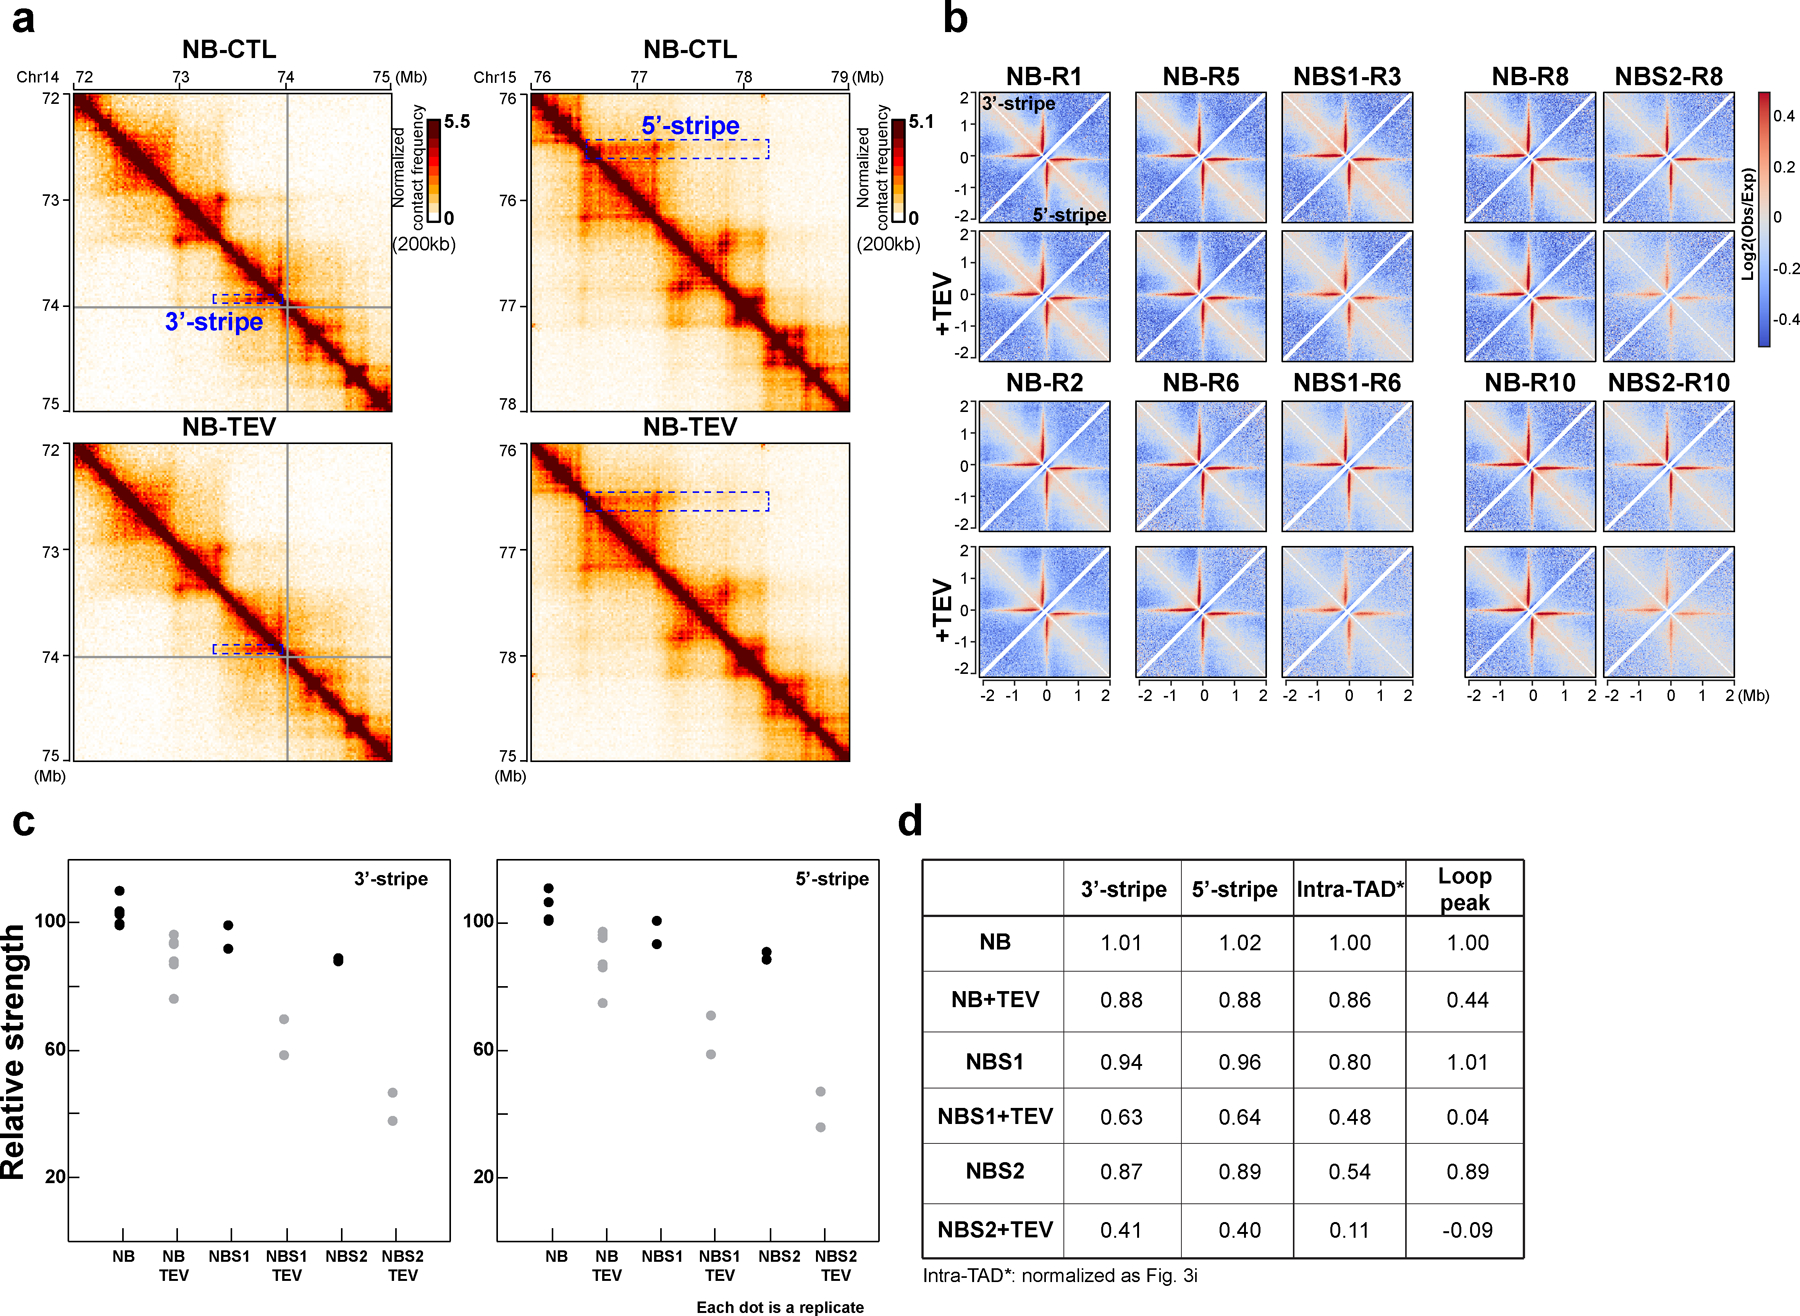
Extended Figure 10. Responses of stripes to RAD21 cleavage in different salt buffers.

(a) The examples of 3′- and 5′-stripes treated with TEV as shown. The left and right columns of the Hi-C interaction maps showed the 72–75 Mb region of chromosome 14 and the 76–79 Mb region of chromosome 15 at 10kb resolution, respectively. On each Hi-C interaction map, the boxes with blue dashed lines highlighted the stripes. The upper and lower Hi-C interaction maps of each column are treated with TEV as shown. (b) Aggregate Hi-C data binned at 10kb resolution at both 3′- and 5′-stripes identified in the sample in NB buffer without TEV treatment. The first two rows indicated the first replicate including Hi-C data without and with TEV treatment in NB, NBS1 and NBS2 as indicated. The third and fourth rows are the second replicate across all the conditions as shown. (c) The relative strength of 3′- and 5′-stripes for all the samples in (b). The median of six replicates without TEV protease treatment in NB buffer was used for normalization. (d) Comparison of stripe strength to the strength of intra-TAD and CTCF-CTCF loop interactions in all samples. The strength of intra-TAD and CTCF-CTCF loop interactions are averages of all replicates in each condition as indicated and were calculated as in Fig. 3i. See source data for numerical data.
