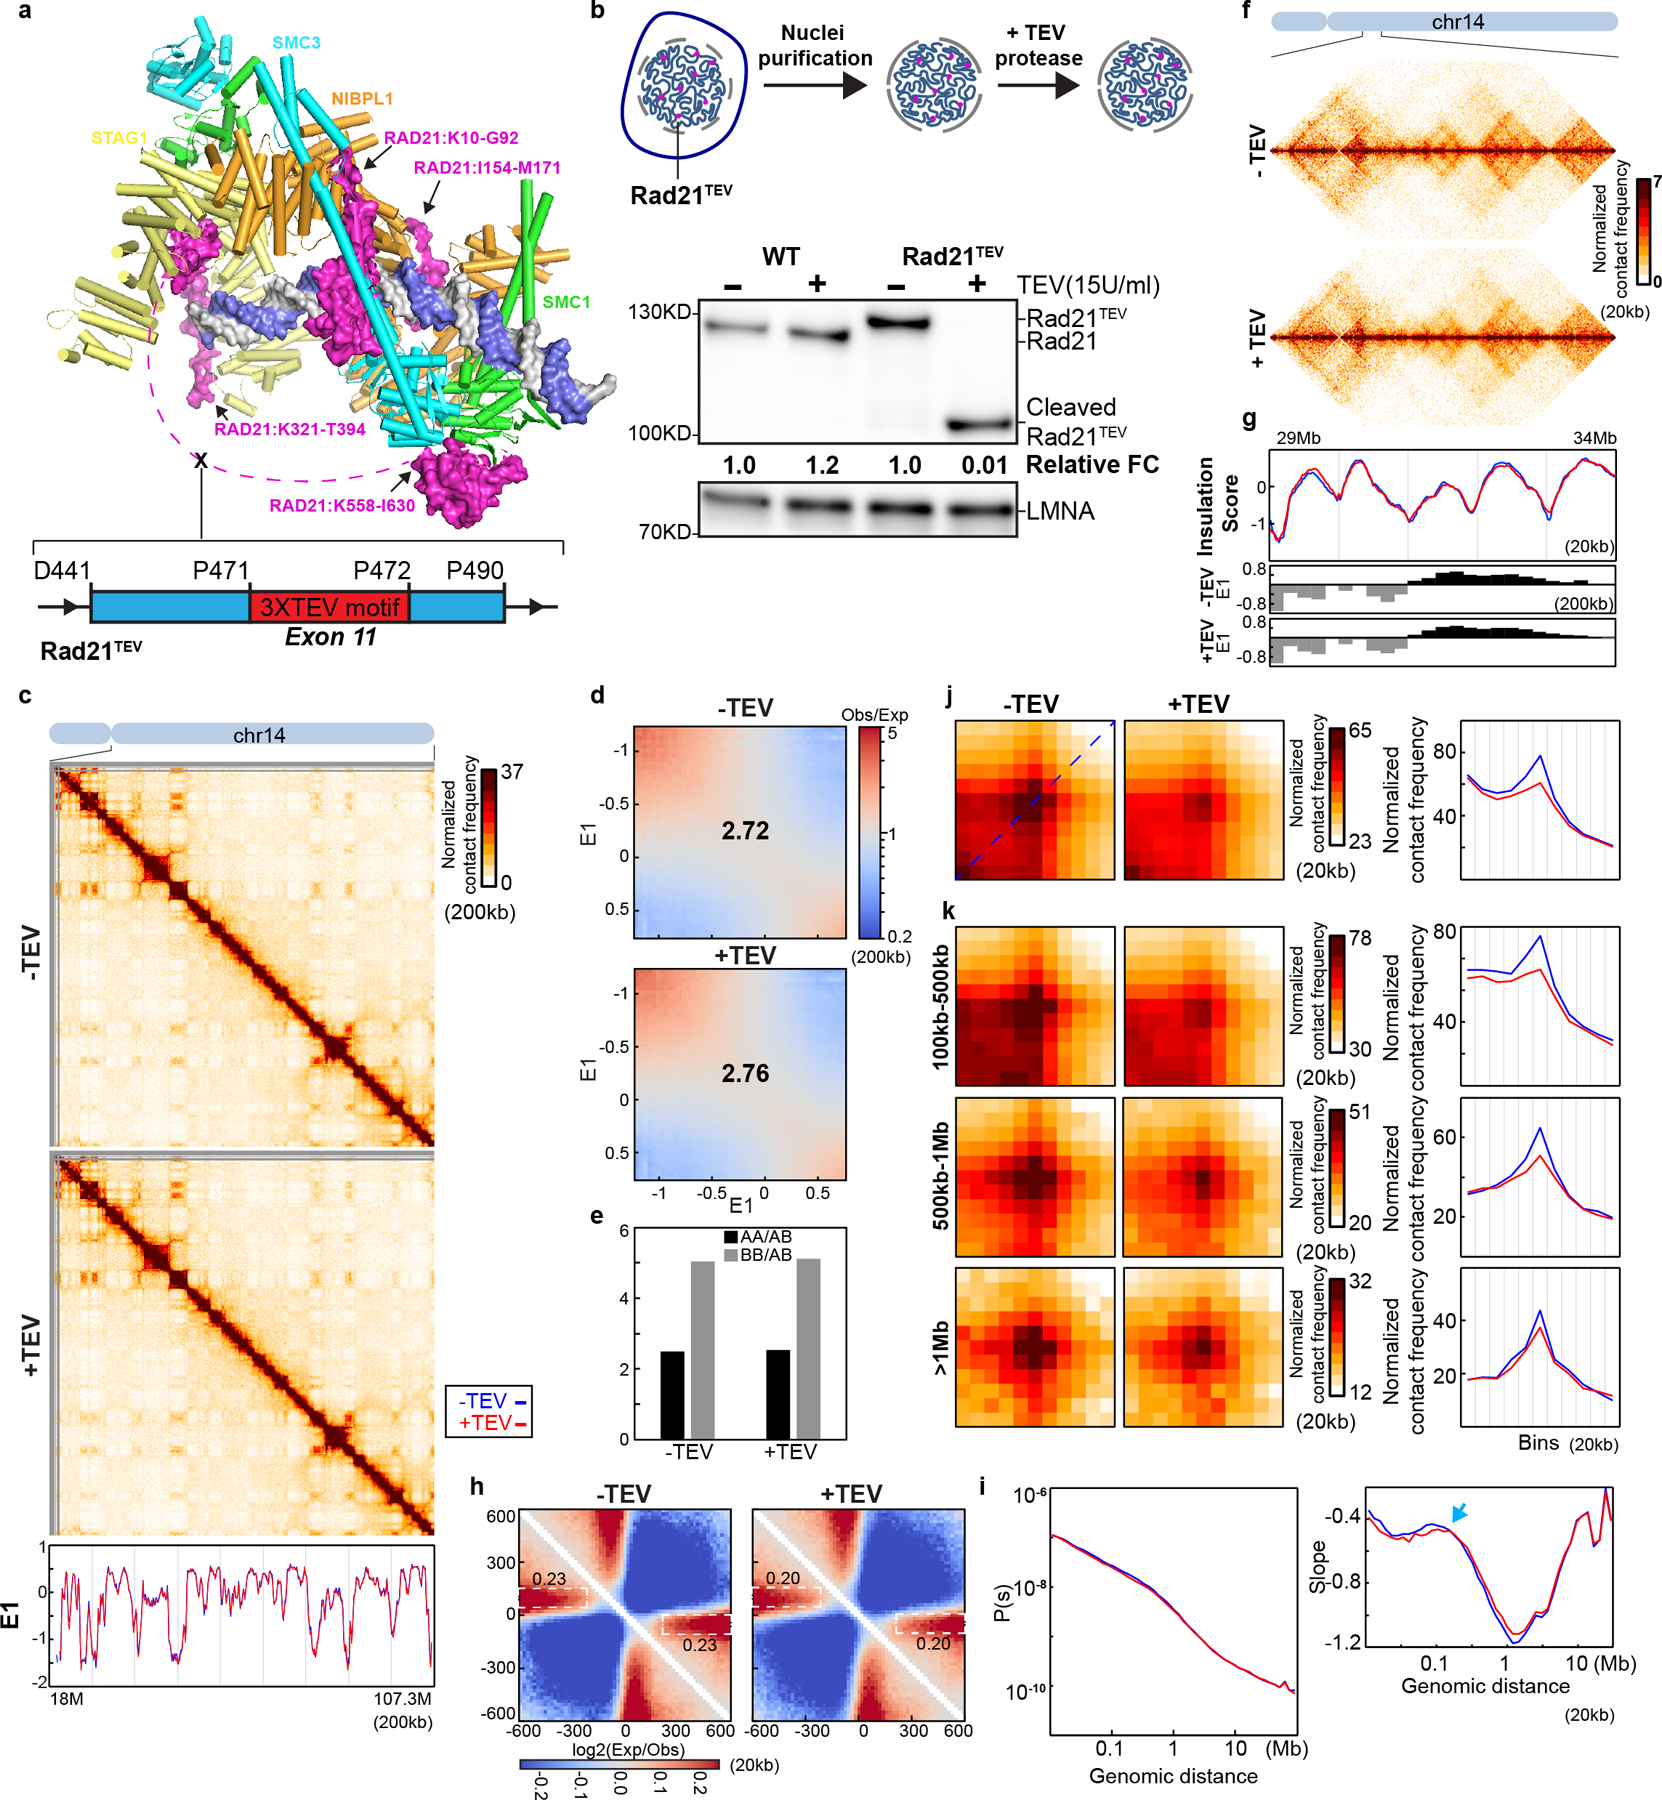
Fig. 2. Cleaving RAD21 reduces CTCF-CTCF loop interactions.

(a) Structure of the cohesin complex in association with DNA, drawn using 6WG3 from Protein Data Bank as published35. The schematic at the bottom illustrates TEV recognition motifs insertion site on RAD21. (b) TEV cleavage assay using purified nuclei (Upper panel). Lower panel, western blot analysis of RAD21 from wild-type and RAD21TEV nuclei treated with TEV as shown. LMNA was used as the loading control. Numbers indicate the relative amount of intact RAD21. (c) Hi-C interaction maps for RAD21TEV nuclei treated with TEV as shown. Data for the 18–107.3 Mb region of chromosome 14. Bottom, eigenvector E1 across the same region. (d) Saddle plots for RAD21TEV nuclei treated with TEV as shown. (e). Interaction strength of compartments. The bars represent the strength of compartment interactions as described in Fig. 1h. (f) Hi-C interaction maps for RAD21TEV nuclei treated with TEV as shown. Data for the 29–34 Mb region of chromosome 14 is shown. (g) Insulation profiles for the same region as in (f). The blue and red lines for panels (g) and (i-k) are as described in (c). The lower panels indicate compartment Eigenvector value E1 across the same region. (h) Aggregate Hi-C data at TAD boundaries identified in the sample in NB buffer without TEV. The numbers at the sides of the cross indicate the strength of boundary-anchored stripes using the mean values of interaction frequency within the white dashed boxes. (i) P(s) plots (upper panels), and the derivatives of P(s) plots (lower panels) for Hi-C data from nuclei treated with TEV as shown. The arrow indicates the signature of cohesin loops. (j) Aggregated Hi-C data at 8334 loops identified in HAP1 cells by14. Right panel: average Hi-C signals along the blue dashed line shown in the left Hi-C panel. (k) Aggregated Hi-C data at chromatin loops of three different loop sizes, 100–500kb, 500kb-1Mb, and >1Mb. Right panel: average Hi-C signals along the blue dashed line shown in the left Hi-C map in (j). See source data for numerical data and unprocessed blots.
