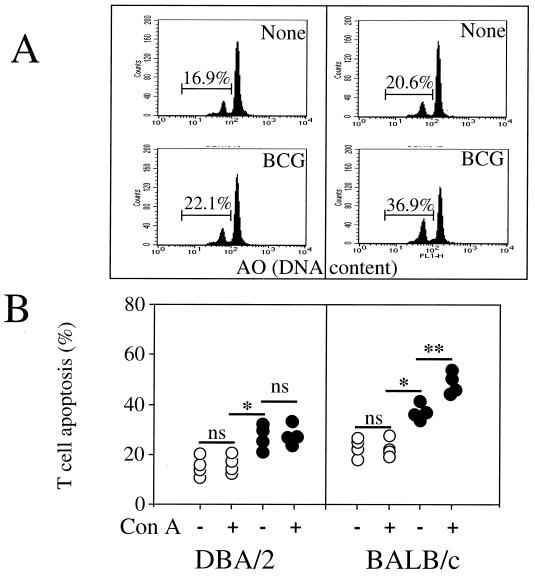
FIG. 4.
T-cell apoptosis in BALB/c and DBA/2 mice. (A) The percentage of spontaneous T-cell apoptosis from individual mice was measured by FCM analysis using acridine orange nuclear dye. (B) T-cell apoptosis of uninfected animals is represented by the open circles, and T-cell apoptosis of BCG-infected animals is represented by the solid circles. Each symbol represents the result from an individual animal. Significant difference in spontaneous T-cell death between uninfected and infected mice is represented by ∗ (P < 0.05); significant difference in T-cell death between nonstimulated and activated T cells is represented by ∗∗ (P < 0.05). ns, not significant.

