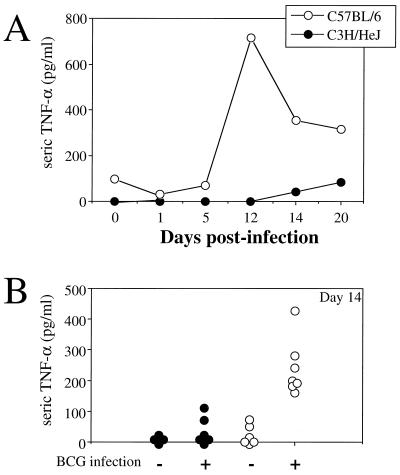
FIG. 7.
Kinetics of TNF-α production during BCG infection. (A) Pools of sera from four C3H/HeJ or C57BL/6 mice collected at several time points during the course of BCG infection were measured by ELISA. (B) Sera from individual mice were analyzed on day 14 postinfection. Each symbol represents the result from an individual animal.

