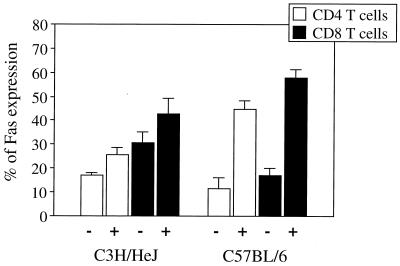
FIG. 8.
Analysis of Fas expression. Fas expression on CD4+ T cells and CD8+ T cells from spleens of C3H/HeJ and C57BL/6 mice was assessed by FCM using Cy-chrome-conjugated anti-CD4 and anti-CD8 and FITC-labelled anti-Fas antibodies prior to (−) or 2 weeks after (+) intravenous infection with 5 × 10⁶ CFU of BCG. Data are expressed as the means and standard deviations from three individual animals per group. Results are from one of three independent experiments with similar results.

