
FIGURE 1.
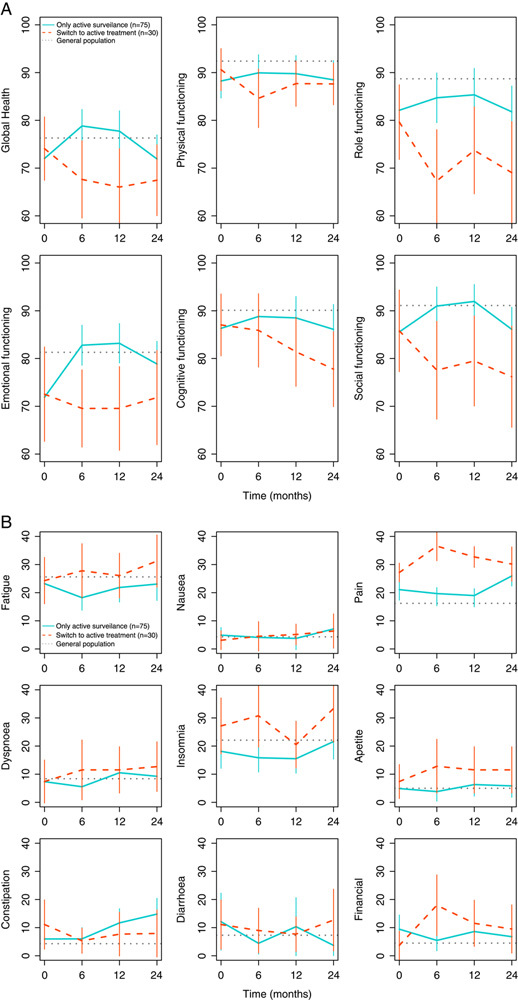
A and B. HRQoL scores from baseline to 24-month follow-up by treatment group for all EORTC QLQ-C30 functioning scales and global health scale (A) and symptom scales and items (B). HRQoL scores of the treatment groups are reported as mean score and 95% confidence interval. The horizontal line presents the mean HRQoL score of the Dutch general population norm data based on Nolte et al14 of males and females aged 30 to 49 years (n=324). A higher score on the functional scales and global quality of life means better functioning and global health, whereas a higher score on the symptom scales means higher symptom burden. HRQoL indicates health-related quality of life.