
Figure 3.
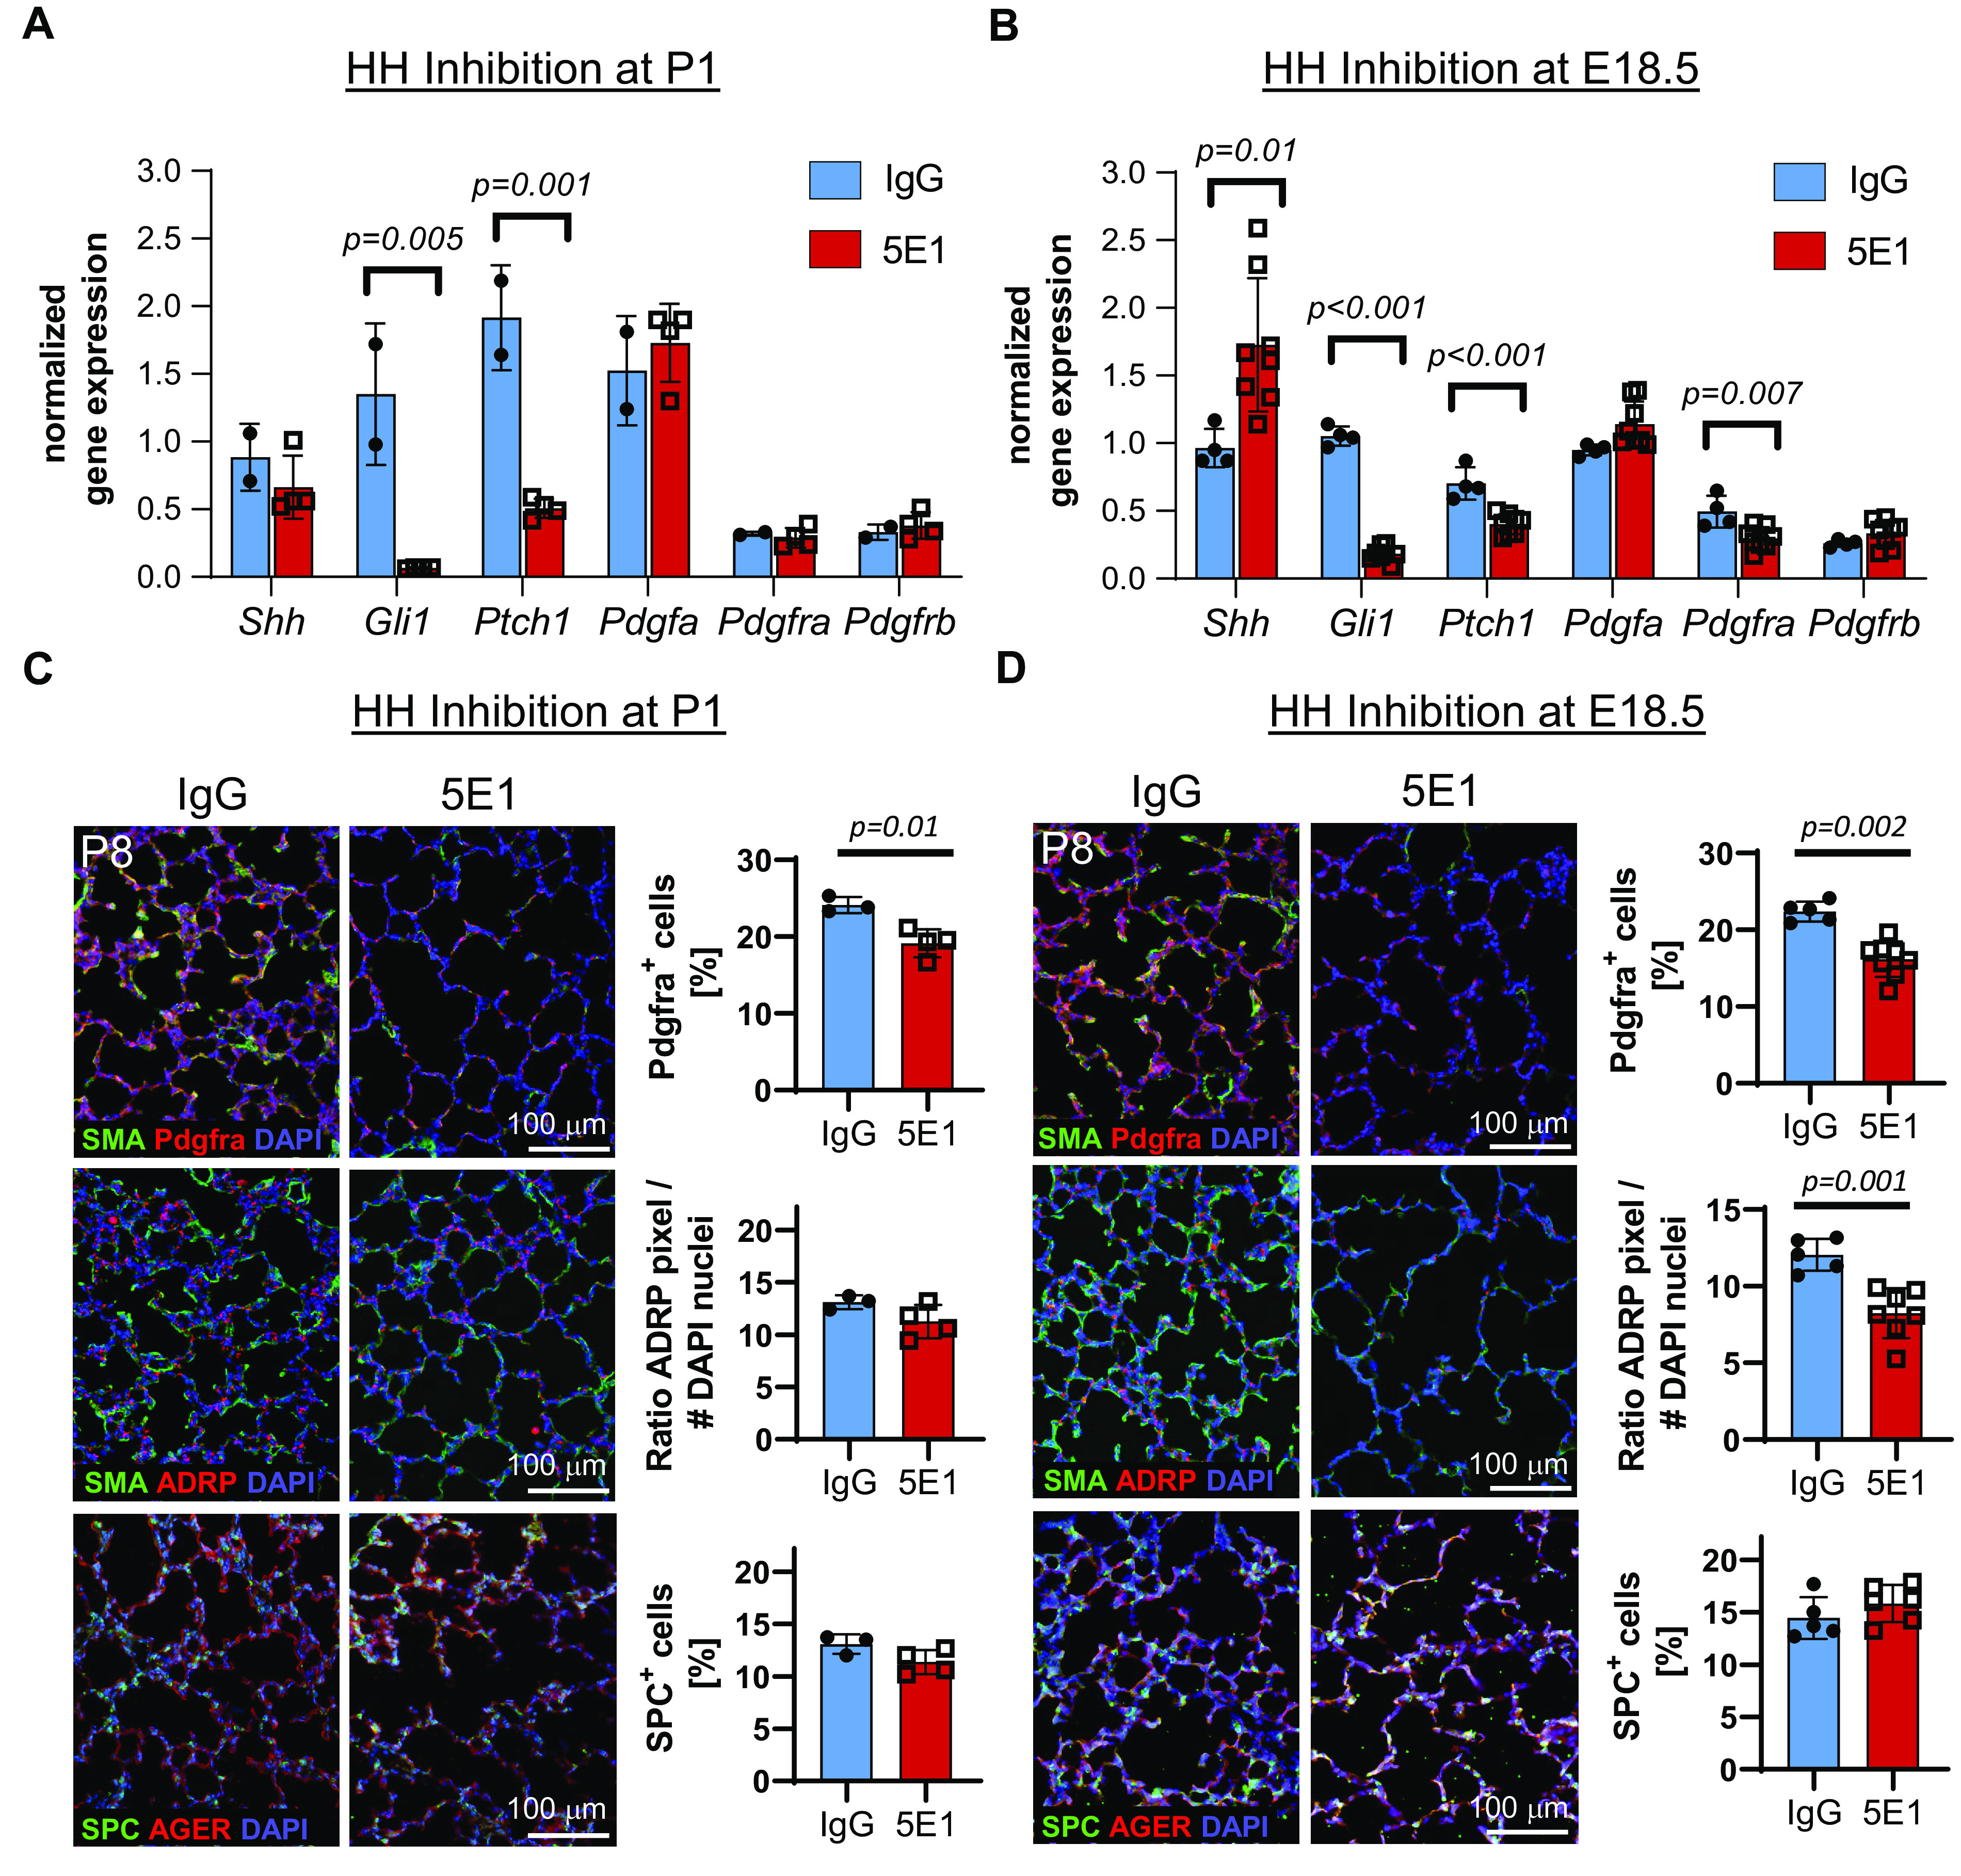
HH inhibition reduces Pdgfra expression and numbers of Pdgfra+ and Pdgfra-lineage cells in postnatal lungs. (A–D) To measure the effect of HH inhibition timing on gene expression of HH and PDGF pathway molecules, HH was inhibited at either P1 (A and C) or E.18.5 (B and D). Gene expression was assessed 48 hours after inhibition using qRT-PCR on total lung RNA at either P3 (A) or P1 (B). Tissue expression of selected cell markers (SMA [myofibroblasts], ADRP [lipofibroblasts], Pdgfra, SPC [alveolar type 2 cells], and AGER [alveolar type 1 cells]) was assessed using immunohistochemistry/immunofluorescence in the lungs at P8. Nuclei are stained with DAPI (blue). Quantitated image data and gene expression data are normalized mean ± SD. P values <0.05 (t test) indicate statistical significance; scale bars, 100 μm. ADRP = adipose differentiation-related protein; AGER = advanced glycosylation end-product specific receptor; Ptch1 = patched 1; Shh = Sonic Hedgehog; SMA = smooth muscle actin; SPC = surfactant protein C.