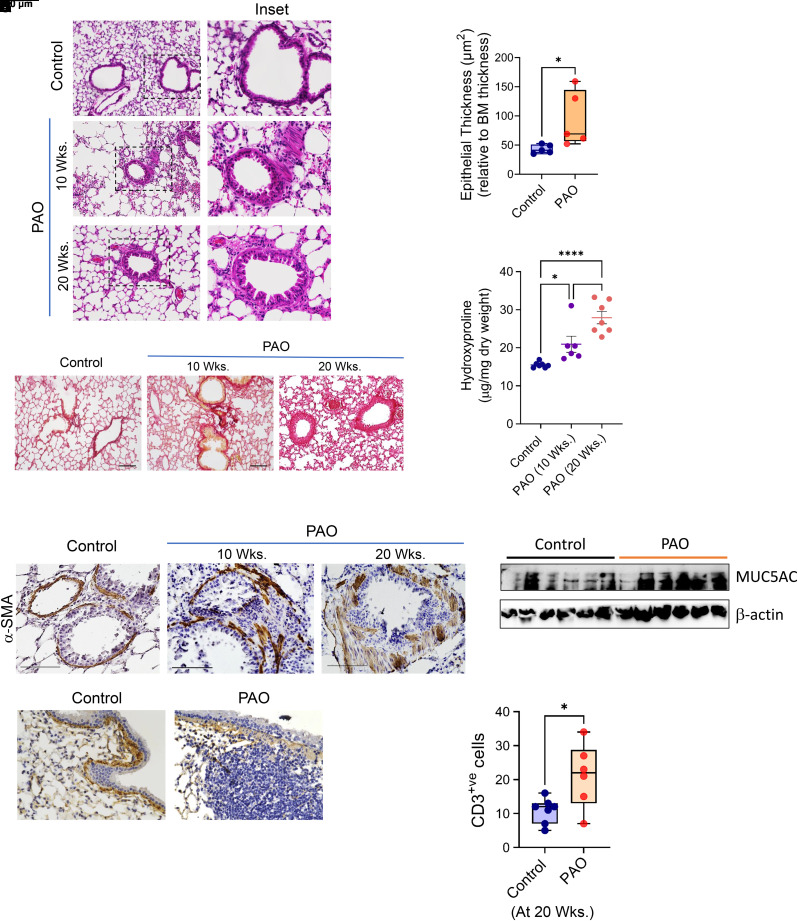
Figure 6.
Cutaneous exposure to PAO causes constrictive bronchiolitis. (A) Histopathological assessment of lung sections stained with hematoxylin and eosin from vehicle- and PAO-exposed mice at Weeks 10 and 20. Scale bars, 100 μm. Inset showing airway remodeling in PAO mouse groups. (B) The measurements of epithelial thickness of airways at 20 weeks. (C) Picrosirius staining showing collagen deposition around airways at Weeks 10 and 20. Scale bars, 100 μm. (D) Hydroxyproline content of whole lung. (E) Representative lung histology with α-SMA staining at Weeks 10 and 20. Scale bars, 100 μm. (F) Immunoblot analysis in whole lung tissue lysates for MUC5AC. β-actin expression was used as loading control. (G) Representative images showing presence of tertiary lymphoid follicles next to the airways in the anti–collagen 1–stained lung sections at 20 weeks. Scale bars, 100 μm. (H) Quantitation of CD3+ cells around airways. In box and whisker plots, box represent interquartile range, whiskers are extreme values, and dots show data points for individual mice. Lines within the boxes represent the median. *P < 0.05 and ****P < 0.0005 versus control; #P < 0.05 PAO 10 weeks versus PAO 20 weeks. P values were determined using one-way ANOVA with post hoc Tukey’s method. n = 5–6, each group.

