Figure 7.
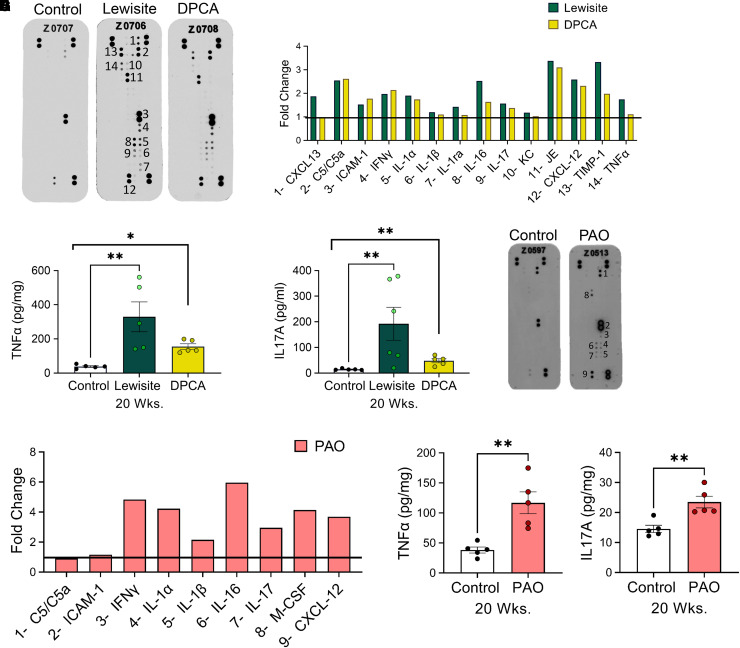
(A) Mouse cytokine antibody array showing expression patterns of different cytokines in serum samples of vehicle control-, lewisite-, and DPCA-exposed mice, and (B) graph showing relative fold change induction of proinflammatory cytokines compared with control mice at 20 weeks. (C) TNF-α (tumor necrosis factor α) and (D) IL-17A ELISA in lung lysates at 20 weeks. (E) Antibody microarray and (F) its densitometry graph from the serum samples from PAO-exposed mice at 20 weeks. (G) TNF-α and (H) IL-17A protein levels in the lung lysates from control mice and PAO group at 20 weeks after exposure. In (A), (B), (E), and (F), the number on the microarray image matches the number in front of the cytokine name on the x-axis of the graph. In these experiments, serum samples of three mice from each group were pooled and incubated with a mouse cytokine antibody array membrane. Densitometry data obtained from the array images were analyzed by National Institutes of Health ImageJ software and presented as the fold changes normalized with control mouse group. (C), (D), (G), and (H), n = 5 mice/group. *P < 0.05 and **P < 0.01, arsenical versus control, using individual Student’s t tests.

