Figure 1.
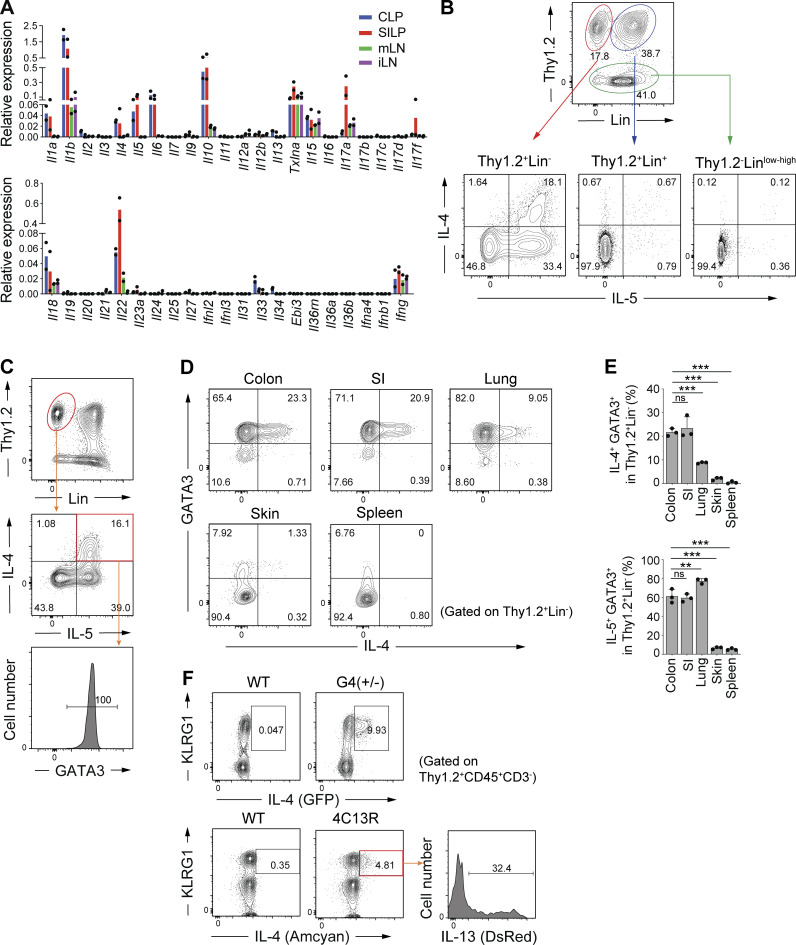
IL-4+ ILC2s are abundant in the colonic LP. (A) Expression of the indicated cytokine genes normalized to Gapdh in lymphocytes from colonic LP (CLP), small intestinal LP (SILP), mesenteric LN (mLN), and inguinal LN (iLN), as quantified using qPCR. (B) Representative flow cytometry plots showing IL-4 and IL-5 expression in three different subsets (Thy1.2+Lin−, Thy1.2+Lin+, Thy1.2−) of colonic LP lymphocytes stimulated with PMA and ionomycin. (C) GATA3 expression in Thy1.2+Lin− IL-4+ IL-5+ cells in colonic LP. (D) Representative flow cytometry plots showing the expression of GATA3 and IL-4 by gated Thy1.2+Lin− cells in the indicated organs. (E) Frequencies of IL-4+GATA3+ cells and IL-5+GATA3+ cells among Thy1.2+Lin− cells in the indicated organs. Bar graphs showed the mean ± SD. ***P < 0.001; **P < 0.01; ns, not significant; one-way ANOVA with Tukey’s test. Each dot represents an individual mouse. (F) Representative flow cytometry plots and histogram showing KLRG1, IL-4, and IL-13 expression by gated colonic LP CD45+ Thy1.2+CD3− cells. Data shown are representative of more than two independent experiments.

