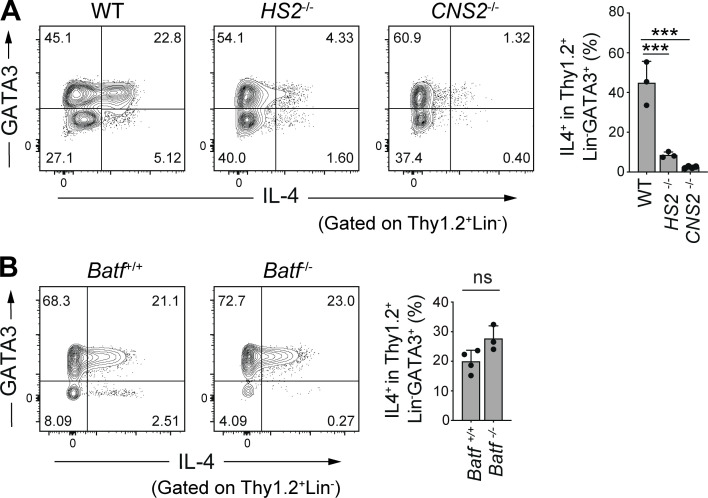
Figure 4.
Unique regulation of Il4 gene expression in colonic IL-4+ ILC2s. (A) Representative flow cytometry plots (left) and frequencies (right) of IL-4+ cells among Thy1.2+Lin−GATA3+ cells in the colonic LP of mice deficient for the HS2 or CNS2 loci of the Il4 gene. (B) Representative flow cytometry plots (left) and frequencies (right) of IL-4+ cells among Thy1.2+Lin−GATA3+ cells in the colonic LP of mice deficient for the Batf gene. Bar graphs show the mean ± SD. ***P < 0.001; ns, not significant; one-way ANOVA with Tukey’s test (A), two-tailed unpaired Student’s t test (B). Each dot represents an individual mouse. Data shown are representative of more than two independent experiments with n ≥ 3 individual mice per group.

