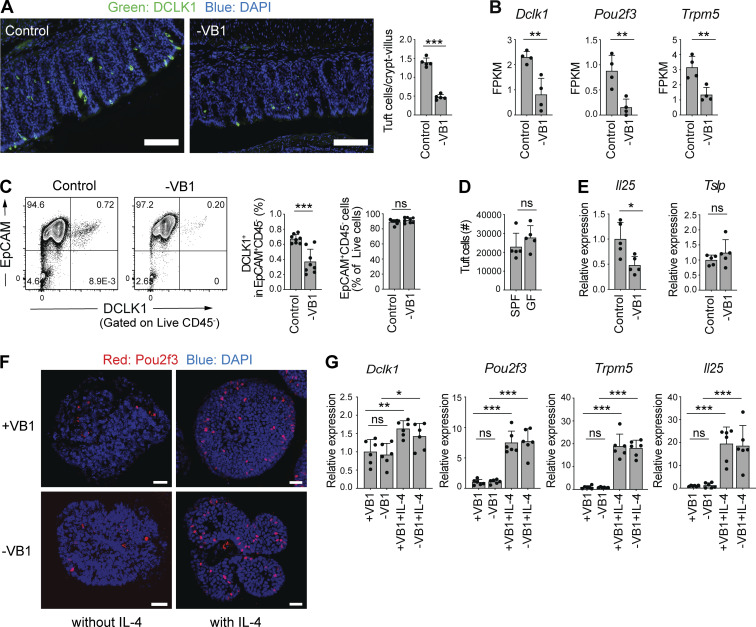
Figure 7.
Dietary VB1 maintains IL-4+ILC2– and IL-25–producing tuft cell populations. (A) Colon sections from SPF B6 mice fed a control or VB1-deficient diet were stained for DCLK1 (green) and DAPI (blue). Scale bar = 100 μm. Bar graph shows the number of DCLK1+ cells per crypt-villus of the colon. (B) Expression of the indicated genes in colonic epithelium isolated from SPF C57/B6 mice fed a control or VB1-deficient (-VB1) diet, as quantified by RNAseq. (C) Representative flow cytometry plots (left) of colonic tuft cells (EpCAM+CD45−DCLK1+). Bar graphs show frequency of colonic DCLK+ cells among CD45−EpCAM+ population and EpCAM+CD45− cells among live cells. (D) The number of tuft cells (EpCAM+CD45−DCLK1+) in the colon of GF and SPF B6 mice was measured by flow cytometry. (E) qPCR quantification of IL-25 and TSLP expression normalized to Actb in the colonic epithelial cell fraction from mice fed a control or VB1-deficient diet. (F and G) Colonic organoids from mice were grown in the presence or absence of VB1, followed by incubation with or without recombinant IL-4. Whole-mount immunofluorescent staining of the organoids with anti-Pou2f3 antibody (red) and DAPI (blue) are shown in F. qPCR quantification of the indicated gene expression normalized to Gapdh is shown in G. Scale bar = 25 μm. Bar graph shows the mean ± SD. ***P < 0.001; **P < 0.01; *P < 0.05; ns, not significant; two-tailed unpaired Student’s t test (A–E), one-way ANOVA with Tukey’s test (G). Each dot represents an individual mouse. Data shown are representative of more than two independent experiments with n ≥ 4 individual mice per group.

