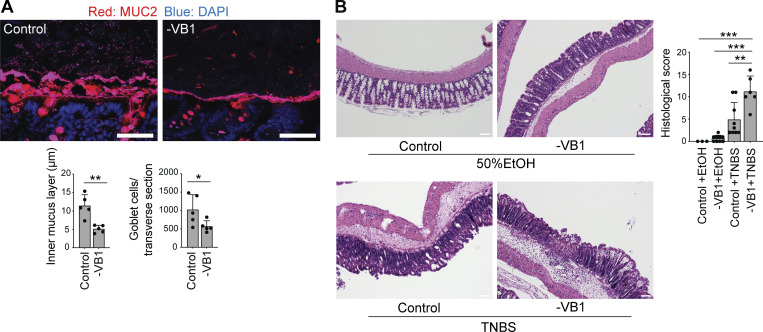
Figure 8.
Exacerbation of experimental colitis by VB1 deficiency. (A) The proximal colon from SPF B6 mice fed a control or VB1-deficient (-VB1) diet were subjected to fluorescence staining with Muc2 (red) and DAPI (blue; upper panels), and the thickness of the inner mucus layer and the number of goblet cells in transverse sections of each mouse were determined using ImageJ software (lower bar graphs). Scale bar = 50 μm. (B) TNBS-colitis was induced in SPF B6 mice fed a control or VB1-deficient diet for 3 wk. H&E staining (left) and histological score (right) of the indicated mice are shown. Scale bar = 100 μm. Scale bar = 100 μm. Bar graph shows the mean ± SD. ***P < 0.001; **P < 0.01; *P < 0.05; two-tailed unpaired Student’s t test (A) and one-way ANOVA with Tukey’s test (B). Each dot represents an individual mouse. Data shown are representative of more than two independent experiments with n ≥ 3 individual mice per group.

