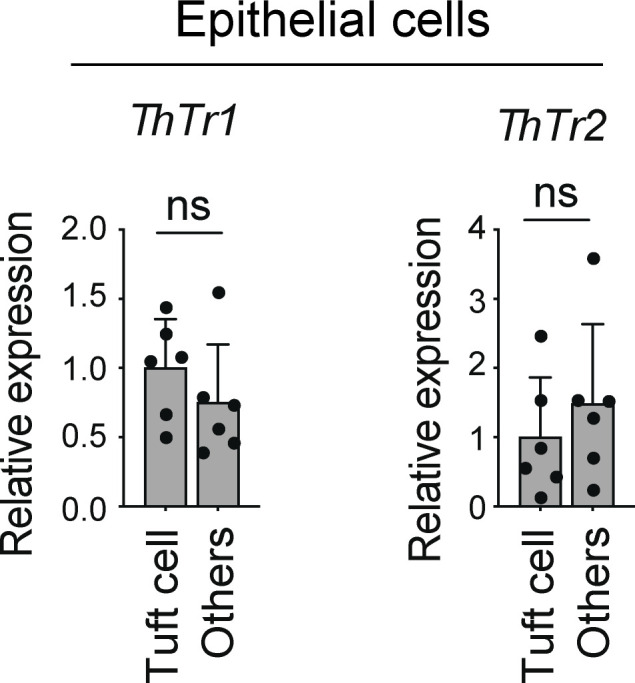
Figure S2.

Expression of VB1 transporters by intestinal epithelial cells. qPCR quantification of ThTr1 and ThTr2 expression normalized to Actb in the colonic tuft cells (EpCAM+CD45−DCLK1+) and other (EpCAM+CD45−DCLK1−) epithelial cells isolated from SPF B6 mice by flow cytometry. ns, not significant; two-tailed unpaired Student’s t test. Each dot represents an individual mouse. Data shown are representative of more than two independent experiments with ≥3 individual mice per group.
