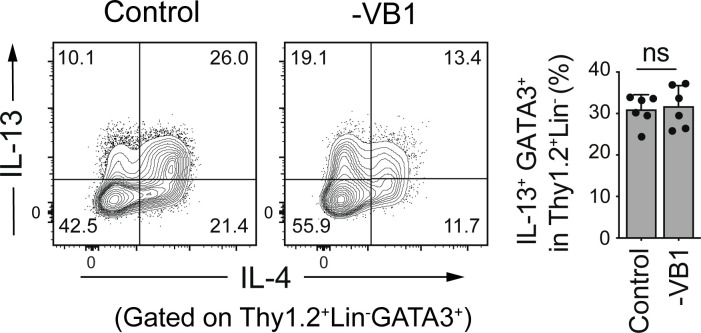
Figure S3.
Influences of VB1-deficiency on IL-13 expression by ILC2s. Representative plots (left) showing the expression of IL-4 and IL-13 by gated Thy1.2+Lin− GATA3+ cells and frequencies (right) of IL-13+GATA3+ cells among Thy1.2+Lin− cells in the colonic LP of SPF B6 mice fed a control or VB1-deficient diet. Bar graphs show the mean ± SD. ns, not significant; two-tailed unpaired Student’s t test. Each dot represents an individual mouse. Data shown are representative of more than three independent experiments with n ≥ 3 individual mice per group.

