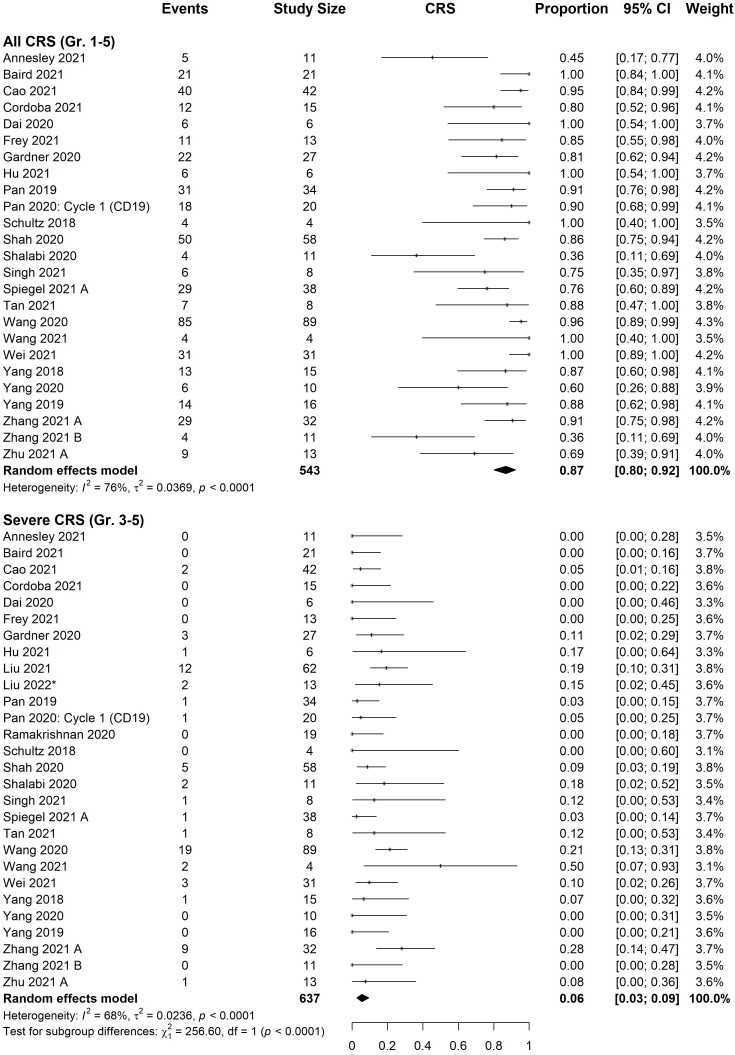
Figure 3.
Forest plot of cytokine release syndrome rate organized by severity. Pooled estimate of effect, black diamond, was calculated for both all grades (1-5) and severe grades (3-5). Pan 2020: cycle 1 (CD19) was excluded from analysis, although rates did not significantly differ from cycle 2 (18/20 all grades, 1/20 severe).

