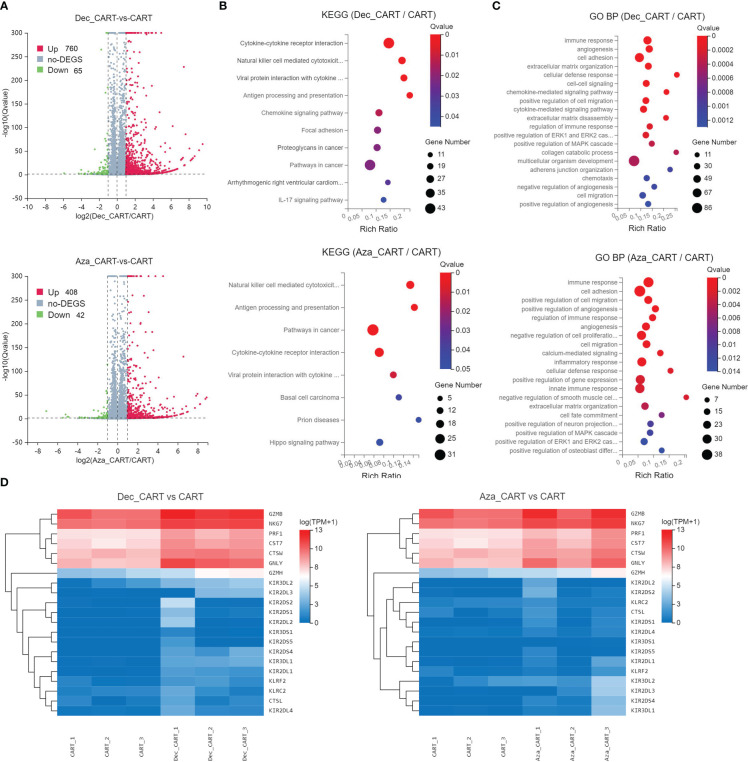
Figure 4.
Analysis of differentially expressed genes and functions of CD44v6 CAR-T cells treated with Dec and Aza. CD44v6 CAR-T cells (n=3) treated with Dec 0.1 μM (Dec_CAR-T) and Aza 1 μM (Aza_CAR-T) for 6 days were measured by RNA-seq. Untreated CD44v6 CAR-T cells were used as controls (CAR-T). (A) Volcano plot of differentially expressed genes (DEGs) in Dec_CAR-T (above) or Aza_CAR-T (below) compared with CAR-T. Red dots represent genes upregulated in Dec_CAR-T or Aza_CAR-T (Qvalue < 0.05 and log2(fold change) ≥1), while blue dots represent genes downregulated in Dec_CAR-T or Aza_CAR-T (Qvalue < 0.05 and log2(fold change) ≤ −1). (B, C) Significantly enriched (Qvalue < 0.05) KEGG pathways (B) and GO BP (C) of all DEGs from Dec_CAR-T (above) or Aza_CAR-T (below) compared to CAR-T. Dot color indicates the statistical significance of enrichment (Qvalue), and dot size represents gene count enriched in each term. (D) Heatmap of differentially expressed cytotoxicity-related genes (Qvalue < 0.001 and log2(fold change) ≥1) from Dec_CAR-T (left) or Aza_CAR-T (right) compared to CAR-T. KEGG, Kyoto Encyclopedia of Genes and Genomes; GO, Gene Ontology; BP, biological process.

