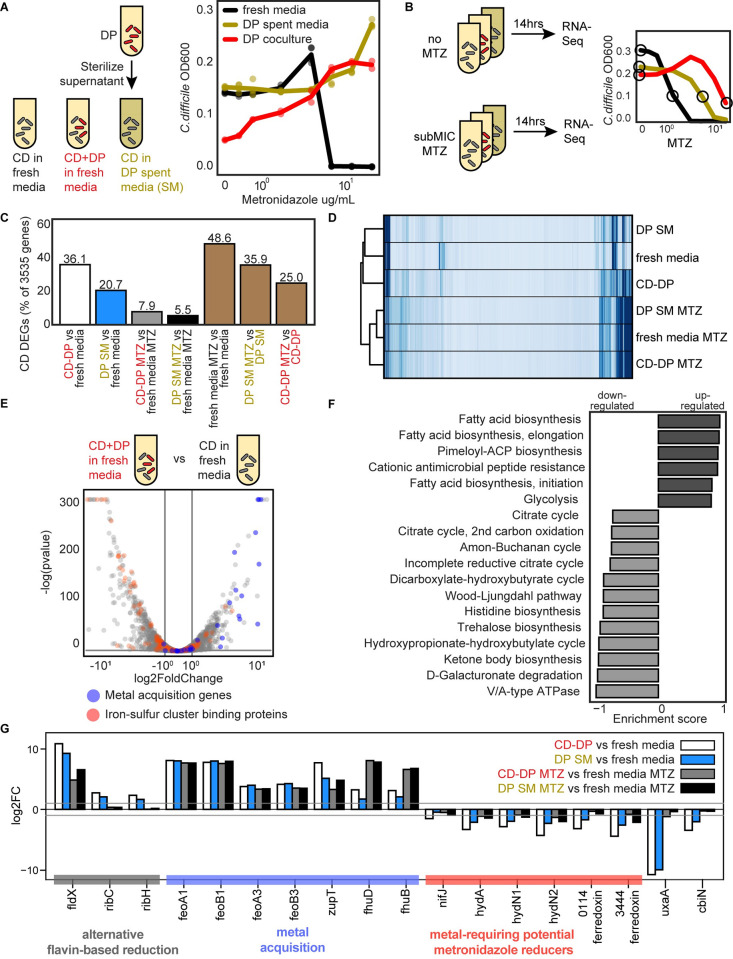
Fig 5. D. piger increases the metronidazole MIC of C. difficile and induces metal starvation genome-wide transcriptional response.
(A) Abundance of C. difficile at 41 h in response to different metronidazole concentrations. The OD600 value for C. difficile in the presence of D. piger is calculated OD600 (OD600 multiplied by relative abundance from 16S rRNA gene sequencing). The x-axis is semi-log scale. Data points represent biological replicates. Lines indicate average of n = 2 to n = 4 biological replicates. (B) Schematic of genome-wide transcriptional profiling experiment. The x-axis is semi-log scale of metronidazole (MTZ) concentration. Lines indicate average C. difficile OD600 at 14 h for n = 4 biological replicates. Circles indicate conditions sampled for RNA-Seq. (C) C. difficile DEGs between culture conditions. DEGs are defined as genes that displayed greater than 2-fold change and a p-value less than 0.05. (D) Clustered heatmap of RPKM for each gene (rows) and in each sample (columns) for C. difficile. Each column represents the average of n = 2 biological replicates. Hierarchical clustering was performed based on Euclidean distance using the single linkage method of the Python SciPy clustering package. (E) Volcano plot of log transformed transcriptional fold changes for C. difficile in the presence of D. piger. Gray vertical lines indicate 2-fold change and the gray horizontal line indicates the statistical significance threshold (p = 0.05). Blue indicates genes annotated to be involved in metal import. Red indicates genes predicted to contain iron-sulfur clusters by MetalPredator [31]. (F) Enriched gene sets in C. difficile grown in the presence of D. piger compared to C. difficile grown in fresh media. All gene sets with significant enrichment scores from GSEA are shown. Gene sets are defined using modules from the KEGG. (G) Bar plot of the log transformed fold changes of a set of genes across different conditions. Gray horizontal lines indicate 2-fold change. The data underlying panels AB in this figure can be found in DOI: 10.5281/zenodo.7626486 and the data underlying panels CDEFG in this figure can be found in DOI 10.5281/zenodo.7049035 and 10.5281/zenodo.7049027 and S3 and S4 Tables. DEG, differentially expressed gene; GSEA, Gene Set Enrichment Analysis; KEGG, Kyoto Encyclopedia of Genes and Genomes; MIC, minimum inhibitory concentration; RPKM, reads per kilobase million.

