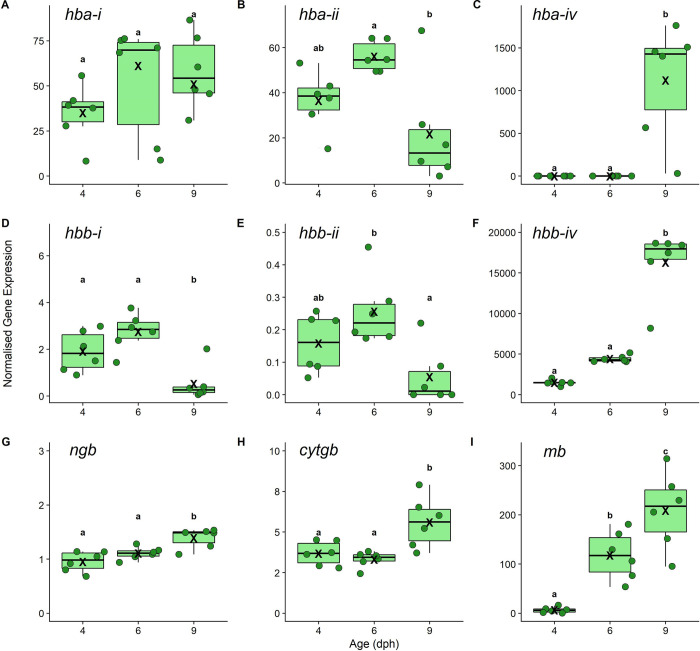
Fig 3.
Normalised gene expression of (A) Hb subunit alpha paralog i (hba-i), (B) paralog ii (hba-ii), (C) paralog iv (hba-iv), (D) Hb subunit beta paralog i (hbb-i), (E) paralog ii (hbb-ii), and (F) paralog iv (hbb-iv), (G) neuroglobin (ngb), (H) cytoglobin paralog ii (cytgb), and (I) myoglobin (mb) measured in larval anemonefish (Amphiprion melanopus) aged 4, 6, and 9 dph. Each point represents normalised gene expression from an individual larva (n = 6 individuals per age). Boxplots show median and interquartile ranges, “X” indicates average gene expression for each day per gene, and different lowercase letters represent statistical differences in normalised gene expression between ages (LMs; α = 0.05). Ensemble gene IDs and data for all genes can be found in sheet 1 in S2 Data. The data underlying this figure can also be found in sheet 4 in S1 Data, and details on statistical outputs can be found in the supporting information S1 StatisticalOutput. dph, days post hatch; Hb, haemoglobin; LM, linear model.

