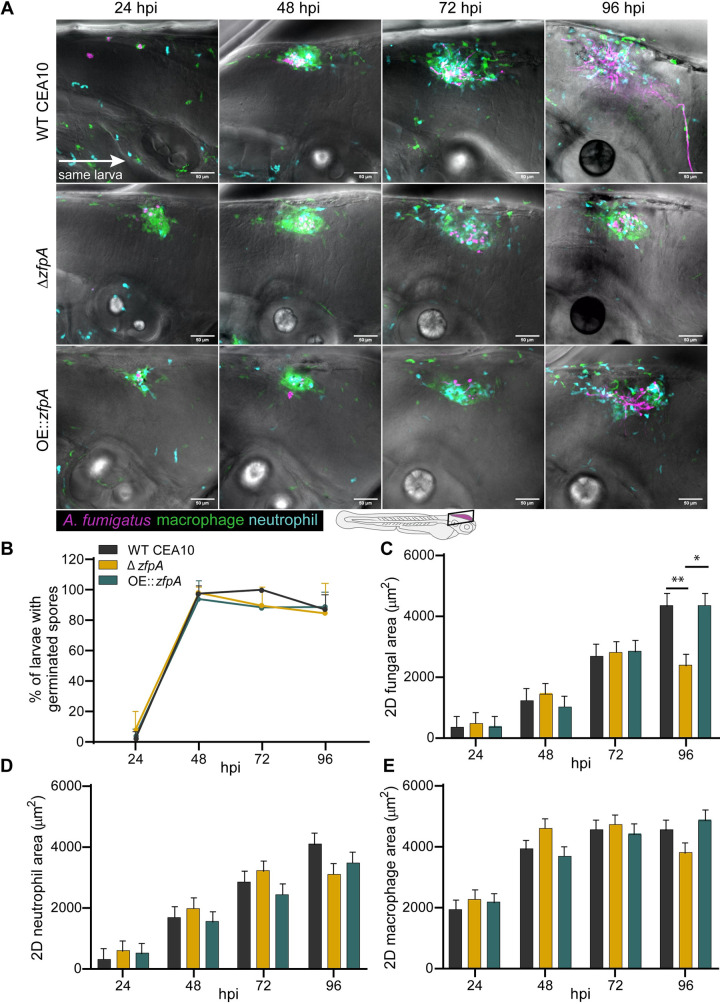
Fig 2. ZfpA controls fungal burden but does not affect immune cell recruitment in wild-type hosts.
2-day post fertilization wild-type larvae with fluorescent macrophages (GFP) and neutrophils (BFP) were infected with RFP-expressing WT CEA10, ΔzfpA, or OE::zfpA strains. Larvae were imaged with confocal microscopy at 24, 48, 72, and 96 hours post infection (hpi). (A) Representative images of fungal growth and immune cell recruitment in the same larva at 24–96 hpi. Images represent maximum intensity projections of z-stacks. Scale bar = 50 μm. (B) Mean percentage of larvae with germinated spores at 24–96 hpi. Dots and error bars represent mean+s.d. (C) 2D fungal (RFP) area at 24–96 hpi. (D) 2D neutrophil (BFP) area 24–96 hpi. (E) 2D macrophage (GFP) area at 24–96 hpi. Bars in (C-E) represent lsmeans+s.e.m. Results represent data pooled from 4 independent experiments. n = 45–48 larvae per condition. p values calculated by ANOVA with Tukey’s multiple comparisons. *p<0.05, **p<0.01.

