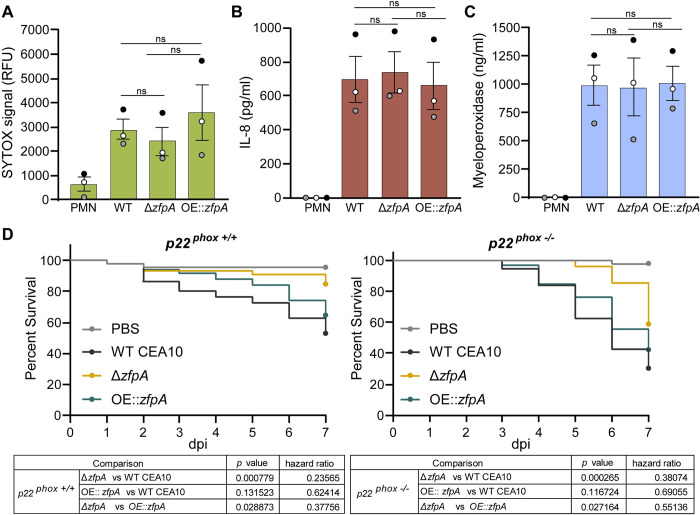
Fig 4. ZfpA has minimal impact on neutrophil effector functions or fungal susceptibility to phagocytic ROS.
(A) Neutrophil extracellular trap formation in response to WT CEA10, ΔzfpA, and OE::zfpA hyphae after 6 h of co-incubation (neutrophil:spore 2:1). Bars represent mean±s.e.m. of relative fluorescent units (RFU) of Sytox Green signal from 3 independent experiments (dots). (B) ELISA quantification of IL-8 production by neutrophils in response to WT CEA10, ΔzfpA, and OE::zfpA hyphae after 3 h of co-incubation (neutrophil:spore 2:1). Bars represent mean±s.e.m. from 3 independent experiments (dots). (C) ELISA quantification of myeloperoxidase release by neutrophils in response to WT CEA10, ΔzfpA, and OE::zfpA hyphae after 3 h of co-incubation (neutrophil:spore 2:1). Bars represent mean±s.e.m. from 3 independent experiments (dots). Statistical comparisons calculated by t-tests. (D) Survival analysis of PHOX-deficient larvae or wild-type siblings injected with PBS, WT CEA10, ΔzfpA, or OE::zfpA strains. p22+/+ larvae average spore dose injected: WT CEA10 = 45, ΔzfpA = 40, OE::zfpA = 42. p22-/- larvae average spore dose injected: WT CEA10 = 35, ΔzfpA = 41, OE::zfpA = 31. Results represent pooled data from 3 independent replicates. n = 45–59 larvae per condition. p values and hazard ratios calculated by Cox proportional hazard regression analysis.

