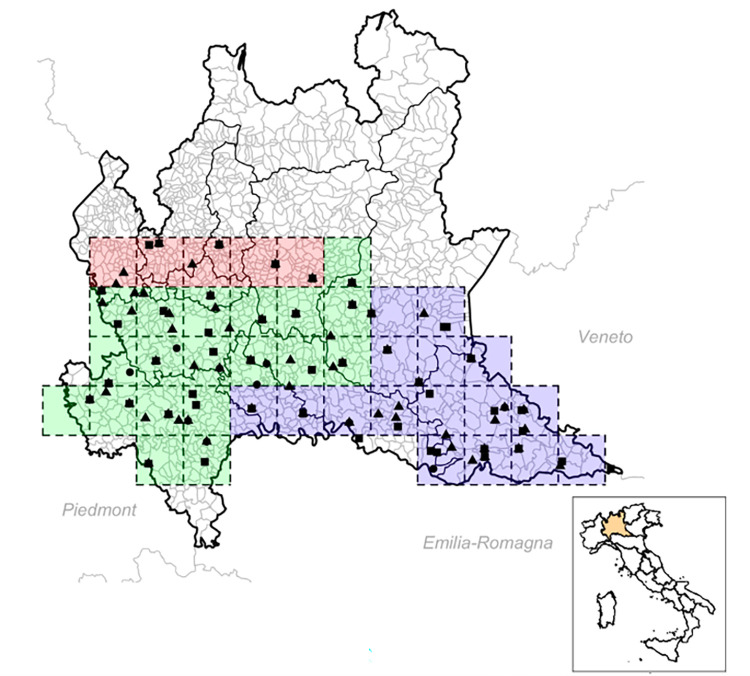
Fig 1. Capture site division proposed for the Lombardy region.
Red quadrats represent the northern subregion, green quadrats represent the western subregion, and blue quadrats represent the eastern subregion. Black squares, circles and triangles represent mosquito capture sites for 2016, 2017 and 2018, respectively. This map was generated using R 4.1.2 (raster package, http://gadm.org source).

