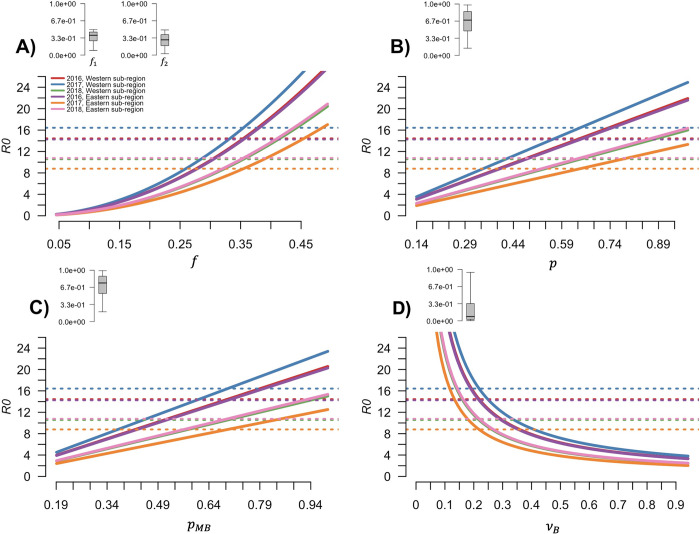
Fig 4. Effect of different changes in model parameters on the Rt ratio.
Effect of A) fraction of bites on competent birds (f); B) bird competence (p); C) bird susceptibility to infection (pMB); and D) duration of infectious period in birds (νB) on R0 in each sub-region and year of simulation (solid lines). Dotted lines represent the mean value of R0. The grey boxplot provided for each panel visualises the posterior distribution of the parameter investigated. The posterior distribution of parameters is visualised using the same y axis to compare the shown distributions.

