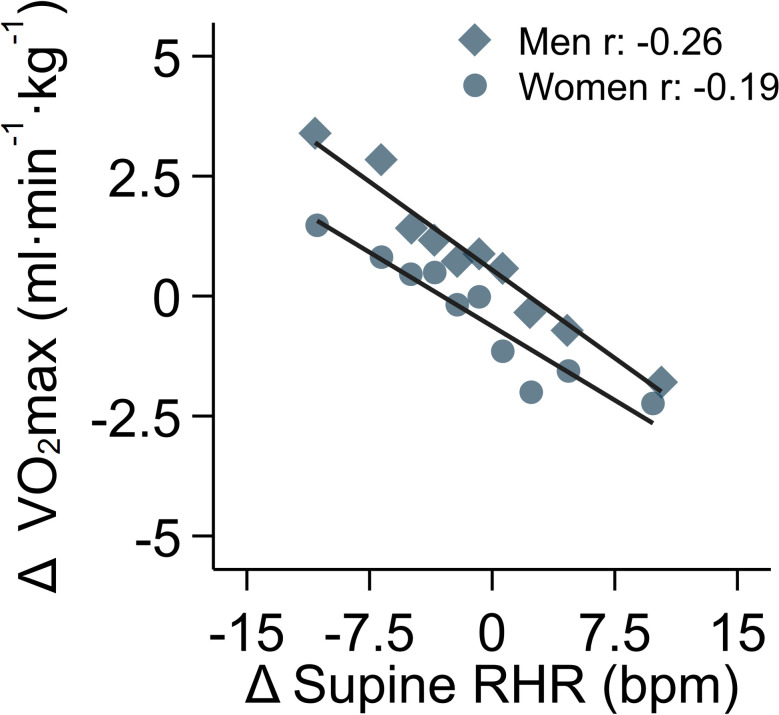
Fig 2. Association between 6-year change in supine resting heart rate and change in estimated maximal oxygen consumption, stratified by sex.
Models were adjusted for follow-up time and baseline values of age, sex, RHR, and estimated VO2max. Longitudinal subsample, the Fenland Study (n = 6,589). Each point represents 5% of the data in the binscatter plot. R values are sex-stratified partial correlation coefficients between change in supine resting heart rate and change in estimated maximal oxygen consumption, adjusted for covariates listed above. P-values for all partial correlation coefficients are less than 0.0001.

