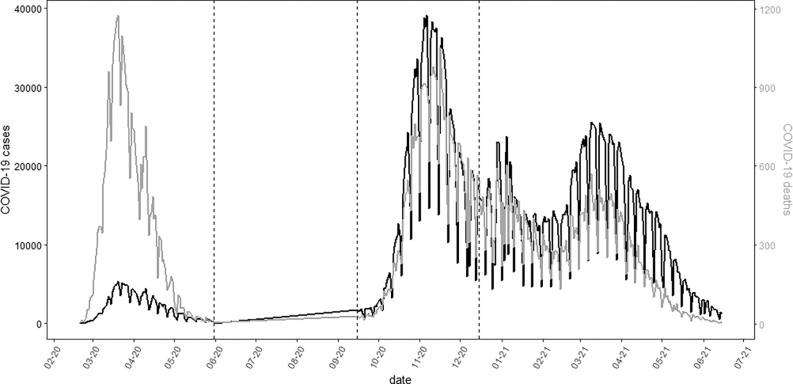
Figure 1.
Time trends of COVID-19 cases (black) and deaths (light gray) between February 2020 and 15 June 2021 in Italy. Relevant data in Excel Table S1. Dashed lines delimit different pandemic waves: first (20 February 2020–31 May 2020), second (15 September 2020–15 December 2020) and third (16 December 2020–15 June 2021).

