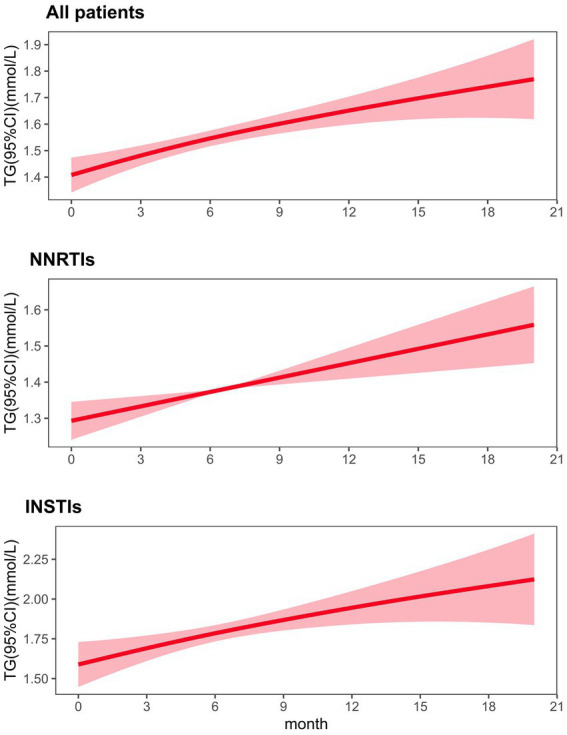
Figure 3.

Fitted value changes in triglyceride (lines) over time and corresponding 95% CIs (shaded areas), stratified by types of ART regimen. The results were based on a generalized additive mixed model adjusted for age, gender and BMI. ART antiretroviral therapy, GAMM generalized additive mixed model, CI confidence interval.
